Volume 25, Number 1—January 2019
Research
Zoonotic Source Attribution of Salmonella enterica Serotype Typhimurium Using Genomic Surveillance Data, United States
Figure 2
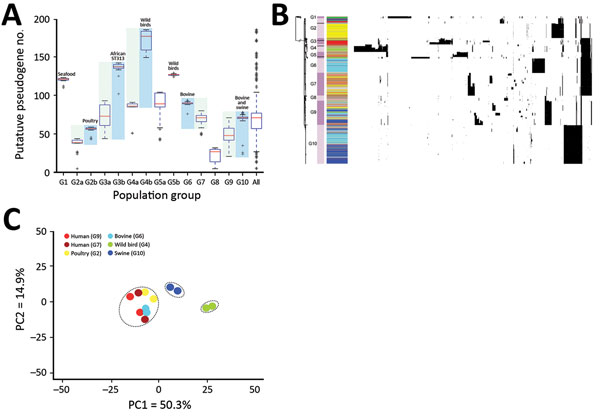
Figure 2. Pseudogene accumulation and metabolic acclimation of Salmonella enterica serotype Typhimurium. A) Abundance of putative pseudogenes in each individual population group or subgroup. Colors indicate each pair of recently diverged clades: light blue indicates source-associated clade; light green indicates diverse-source clade. B) Distribution of putative pseudogenes among Salmonella Typhimurium genomes by source. Cyan, bovine; yellow, poultry; light green, wild bird; blue, swine; dark green, miscellaneous food; red, human; gray, other sources. Purple bars delineate different population groups; black lines within these bars indicate subgroup divisions: G2a and G2b, G3a and G3b, G4a and G4b, and G5a and G5b. The presence of a pseudogene in an isolate is shown as a black spot in the corresponding location. Horizontally, these pseudogenes are hierarchically clustered on the basis of their distribution among analyzed isolates. C) Principal component analysis of metabolic profiles of selected isolates. Results from 2 replicate Phenotype Microarray (Biolog, https://biolog.com) analyses are shown for each isolate. PC, principal component.