Volume 25, Number 4—April 2019
Research
Spatial Dynamics of Chikungunya Virus, Venezuela, 2014
Erley Lizarazo1, Maria Vincenti-Gonzalez1, Maria E. Grillet2, Sarah Bethencourt, Oscar Diaz, Noheliz Ojeda, Haydee Ochoa, Maria Auxiliadora Rangel, and Adriana Tami2
Figure 3
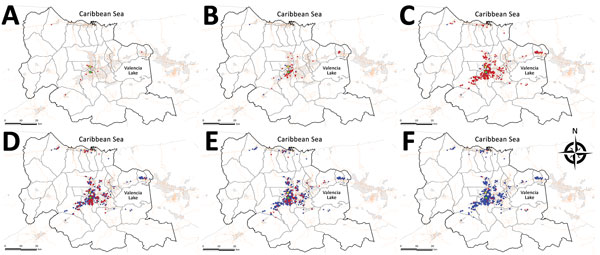
Figure 3. Spatial and temporal spread of chikungunya epidemic, Carabobo state, Venezuela, June–December 2014. Time is presented at epidemiologic week intervals as follows: A) weeks 22–27; B) weeks 28–31; C) weeks 32–35; D) weeks 36–39; E) weeks 40–45; F) weeks 46–49. Red circles indicate the appearance of new cases for the given interval; blue indicates the cumulative cases in prior intervals. Light yellow lines depict the road system of the area of study; light gray areas represent the populated areas (urban centers) within the parishes. Yellow star indicates index case; green diamond indicates first autochthonous case.
1These authors contributed equally to this article.
2These authors contributed equally to this article.
Page created: March 17, 2019
Page updated: March 17, 2019
Page reviewed: March 17, 2019
The conclusions, findings, and opinions expressed by authors contributing to this journal do not necessarily reflect the official position of the U.S. Department of Health and Human Services, the Public Health Service, the Centers for Disease Control and Prevention, or the authors' affiliated institutions. Use of trade names is for identification only and does not imply endorsement by any of the groups named above.