Volume 25, Number 4—April 2019
Research
Spatial Dynamics of Chikungunya Virus, Venezuela, 2014
Cite This Article
Citation for Media
Abstract
Since chikungunya virus emerged in the Caribbean region in late 2013, ≈45 countries have experienced chikungunya outbreaks. We described and quantified the spatial and temporal events after the introduction and propagation of chikungunya into an immunologically naive population from the urban north-central region of Venezuela during 2014. The epidemic curve (n = 810 cases) unraveled within 5 months with a basic reproductive number of 3.7 and a radial spread traveled distance of 9.4 km at a mean velocity of 82.9 m/day. The highest disease diffusion speed occurred during the first 90 days, and space and space–time modeling suggest the epidemic followed a particular geographic pathway with spatiotemporal aggregation. The directionality and heterogeneity of transmission during the first introduction of chikungunya indicated existence of areas of diffusion and elevated risk for disease and highlight the importance of epidemic preparedness. This information will help in managing future threats of new or reemerging arboviruses.
Chikungunya, a reemerging mosquitoborne viral infection, is responsible for one of the most explosive epidemics in the Western Hemisphere in recent years. Since its introduction in the Caribbean region at the end of 2013, chikungunya virus (CHIKV) rapidly expanded within a year to most countries of South, Central, and North America (1,2). CHIKV belongs to the genus Alphavirus (Togaviridae), first isolated in Tanzania during 1952 (3). Its sylvatic (enzootic) cycle in Africa involves nonhuman primates; the virus is transmitted by an ample range of forest-dwelling Aedes spp. mosquitoes (4). Within the urban (human) cycle across Asia, the Indian Ocean, and the Americas, CHIKV is transmitted by Aedes aegypti and Ae. albopictus mosquitoes (5–7). Most (72%–93%) infected persons develop symptomatic disease characterized by fever, rash, and incapacitating arthralgia, progressing in 42%–60% of patients to chronic, long-lasting relapsing or lingering rheumatic disease (8,9). The lack of population immunity to CHIKV in the Americas alongside the ubiquitous occurrence of competent Ae. aegypti mosquitoes and human mobility may explain the rapid expansion of CHIKV across the Americas; cases doubled each month during the epidemic exponential phase (10,11). At the end of 2014, >1 million suspected and confirmed cases, including severe cases and deaths, were reported in 45 countries and territories; this figure reached almost 3 million cases by mid-2016 (12). The real number of cases is most likely higher because of misdiagnosis with dengue virus (DENV) infection and underreporting.
In Venezuela, the first official imported chikungunya case was reported in June 2014, and local transmission followed soon thereafter. Chikungunya quickly spread, causing a large national epidemic affecting the most populated urban areas of northern Venezuela, where DENV transmission is high. Given the paucity of official national data, epidemiologic inference was used to estimate the number of cases. Although nationally the disease attack rate was estimated at 6.9%–13.8% (13), the observed attack rate in populated urban areas was ≈40%–50%, comparable to those reported in the Dominican Republic (14) and Asia and higher than those in La Reunion (15,16).
The rapid expansion and worldwide spread in the last decade make CHIKV one of the most public health–relevant arboviruses (17). With the reemergence of other arboviruses, new large-scale outbreaks in the near future seem likely (18). Clarifying and quantifying the introduction and propagation range in space and time of the initial epidemic wave of chikungunya within the complex urban settings of Latin America will shed light on arboviral transmission dynamics and help in managing future threats of new or emerging arboviruses operating under similar epidemiologic dynamics. We characterized the epidemic wave of chikungunya in a region highly affected by the 2014 outbreak in Venezuela. To this end, we described the spatial progression of the epidemic using geographic information systems (GIS), quantified the global geographic path that CHIKV most likely followed during the first 6 months of the epidemic by fitting a polynomial regression model (trend surface analysis), determined the general direction and speed of the propagation wave of the disease, and identified the local space–time disease clusters through spatial statistics.
Study Area
Figure 1
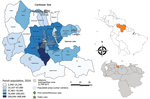
Figure 1. Area of study on the spatial dynamics of chikungunya virus, Carabobo state, Venezuela, 2014. Blue shading indicates 2014 population by parish. Most persons live in the capital city of Valencia (892,530...
Carabobo State is situated in the north-central region of Venezuela (Figure 1). It is one of the most densely populated regions (19).
Study Design and Data Collection
To determine the spatiotemporal spread of the 2014 chikungunya epidemic at local and global scales, we conducted a retrospective study of patient and epidemiologic data collected through the national Notifiable Diseases Surveillance System (NDSS). Suspected chikungunya was diagnosed in 810 persons of all ages by their physicians; these patients were reported through the NDSS to the epidemiologic department of the Regional Ministry of Health of Carabobo State. Patients suspected of having chikungunya were those with fever of sudden onset, rash, and joint pain with or without other influenza-like symptoms. Patients who attended public or private healthcare centers across Carabobo State municipalities were included in this study.
Patient data were obtained for June 10–December 3, 2014 (epidemiologic weeks 22–49), coinciding with the Venezuela chikungunya outbreak. Data corresponding to the first visit of the patients to a healthcare center were included and comprised patient address, clinical manifestations, and epidemiologic risk factors. This information was entered in a database, checked for consistency, and analyzed anonymously. We defined the index case as the first chikungunya patient reported by the NDSS within this region.
Temporal Dynamics of CHIKV Spread
We described the growth rate of the disease by plotting the cumulative cases per epidemiologic week and fitted a logistic curve after examining the shape of the epidemiologic curve (Appendix Figure 1). We estimated the average number of secondary cases resulting from a primary case in a completely susceptible population— the epidemic’s basic reproductive number (R0)—from the initial phase of the epidemic using the exponential growth method (20) and then calculated a real-time estimate of R0, called Rt (21,22), to explore the time-varying transmissibility of chikungunya (Appendix).
Spatiotemporal Trend of the Epidemic Wave of Chikungunya
Figure 2
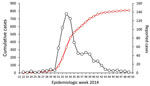
Figure 2. Reported chikungunya cases during epidemic, Carabobo state, Venezuela, 2014. Black line with open black dots indicates chikungunya cases; red line with open red diamonds, cumulative cases.
We georeferenced the address of every patient into a GIS so that the Xi (east–west) and Yi (north–south) coordinates of each chikungunya case were derived. We drew the weekly spatial progression of the 810 reported cases with respect to the index case in a map. To assess the spreading pattern before the epidemic reached the steady (plateau) state (Figure 2), we selected cases that occurred 0–125 days (up to epidemiologic week 40) after the index case. Within this time range, the case notification rate maintained a sustained growth.
To explore the general spatial trend of chikungunya cases (or the movement of the epidemic wave of infection) across the study area, we developed a map of time of disease spread using trend surface analysis, a global surface fitting method (Appendix). We created the variable time (in days) using the symptom onset date from the index case as the baseline date across the 810 case localities; that is, time (Xi, Yi). Thus, time is considered the number of days elapsed between the appearance of a case in a specific locality Zi and the index case. We used results of the trend surface analysis to generate a contour map or smoothed surface; each contour line represented a specific predicted time period in this urban landscape setting since the initial invasion of the virus. The local rate and direction of the spread of infection was estimated as the directional derivative at each case using the trend surface analysis fitted model to obtain local vectors that depicted the direction and speed (inverse of the slope along the direction of the movement) of infection propagation from each locality in X and Y directions. In addition, we used kriging, a local geostatistical interpolation method, to generate an estimated continuous surface from the scattered set of points (i.e., time) with z value to better capture the local spatial variation of chikungunya spread across the urban landscape (23). We used ordinary kriging to predict values of the time period since the initial invasion of the virus. We selected the model with the best fit out of 3 theoretical variogram models tested by cross-validation to predict the values at unmeasured locations and their associated errors (Appendix).
We also obtained an empirical basic baseline rate of disease spread to quantify the observed velocity for each case zi directly from the data by measuring the linear distance (meters) of case Zi to the index case and then dividing it by the time in days that elapsed since the index case was reported. We assessed differences between velocities by using the Kruskal-Wallis test, a nonparametric method to test differences between groups when these are nonnormally distributed (24).
Finally, to identify general space–time clusters of chikungunya transmission, we performed a Knox analysis (25), and to identify interactions at specific temporal intervals, we used the incremental Knox test (IKT) (26). For general space–time clusters we selected critical values of 100 m (distance) and 3 weeks (time) after multiple distance and time windows testing (Appendix Table 2). Our selection was based on the Aedes mosquito flight range and the maximum duration of the intrinsic and extrinsic incubation periods of the virus, respectively (27,28). Upon identification of the cluster, we calculated the distance between the first case of a cluster (C1) and the cases within the cluster Zi, considering this distance as a measure of virus disease spread. For interactions at specific temporal intervals, we used the IKT in an exploratory mode over the time intervals from 1 day to 31 days and space distances from 25 m to 500 m (Appendix). We conducted spatial analyses using R software (The R-Development Core Team, http://www.r-project.org) and ArcGIS version 10.3 (ESRI Corporation, https://www.esri.com) using the Spatial Analyst Toolbox and generated maps with Quantum GIS 2.14.3 Essen (QGIS Development Team GNU—General Public License, https://www.qgis.org) software). Space-time (Knox) analysis was performed using ClusterSeer 2.0 (Terraseer, https://www.biomedware.com/software/clusterseer).
Ethics Statement
Data were analyzed anonymously, and individuals were coded along with the information of address with a unique numeric identifier. The epidemiologic department of the Regional Ministry of Health of Carabobo State approved the study.
Temporal Dynamics of CHIKV Spread
A total of 810 suspected chikungunya cases were reported in Carabobo State in 2014 during epidemiologic weeks 22–49 (28 weeks), representing the first introduction and propagation of the virus in the north-central region of Venezuela. The index case was an imported case (in a returning traveler from the Dominican Republic) in epidemiologic week 22 in the north-central zone of the capital city (Valencia) (Figure 1). The index case was followed by the other imported cases and soon after by locally transmitted cases.
The cumulative cases during epidemiologic weeks 22–49 followed a logistic growth (Appendix Figure 1; R = 0.99, n = 810; p<0.05). The reported cases displayed a characteristic epidemic curve with a single wave and peaked at epidemiologic week 33, eleven weeks after the index case (Figure 2). The epidemic takeoff occurred at epidemiologic week 31 (i.e., 9 weeks after the index case). The total duration of the outbreak was ≈28 weeks; however, the main epidemic curve lasted ≈3 months, from epidemiologic week 30 until epidemiologic weeks 43–44. The initial global growth rate of the epidemic was 0.53 cases per week, and R0 = 3.7 (95% CI 2.78–4.99) secondary chikungunya cases per primary case (epidemiologic weeks 22–31). We obtained comparable results when we calculated the instantaneous reproductive number (Rt = 4.5, 95% CI 2.4–7.1) during the epidemic peak. Beginning with epidemiologic week 34, Rt values fell below 1, and they gradually decreased from there onward (Appendix Figure 2).
Spatiotemporal Distribution of the Chikungunya Epidemic
Figure 3
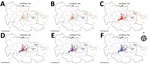
Figure 3. Spatial and temporal spread of chikungunya epidemic, Carabobo state, Venezuela, June–December 2014. Time is presented at epidemiologic week intervals as follows: A) weeks 22–27; B) weeks 28–31; C) weeks 32–35; D)...
Video
Video. Spatial progression of chikungunya outbreak, Carabobo state, Venezuela, June 10–December 3, 2014 (epidemiologic weeks 22–49).
The chikungunya outbreak progressed chronologically and spatially through Carabobo State (Figure 3; Video). The cases reported in Valencia during the first 6 weeks were located in the central area of the city close to the index case, whereas a few cases were reported in the southwestern part of Valencia and in other small urban towns of Carabobo (Figure 3, panel A). The first autochthonous case occurred during this interval in the south-central area of Valencia, relatively close to the index case (Figure 3, panel A). During epidemiologic weeks 28–31, the number of reported cases increased in parishes around the autochthonous case (Figure 3, panel B). During epidemiologic weeks 32–35, the number of cases exploded exponentially, and the disease spread rapidly throughout the capital city and surrounding smaller urban centers (Figure 3, panel C). New cases were actively reported during 8 continuous weeks (Figure 3, panels C, D) to later decrease from epidemiologic week 40 to epidemiologic week 49 (Figure 3, panels E, F). The epidemic progressed in 2 directions (movement axes) in the region: a north–south direction and a northeastern and southwestern direction. Both shifts consistently overlapped with the populated centers of the region and the main traffic routes (motorways and main roads).
Figure 4
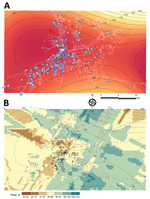
Figure 4. Global and local predicted spreading patterns of chikungunya virus, Carabobo state, Venezuela, 2014. A) Contour map (global scale) of the predicted spreading waves and the velocity vector arrows of each case...
Figure 4, panel A, depicts the general direction and propagating wave of disease derived from the trend surface analysis. Contour lines that are far apart indicate that the epidemic diffused quickly through the area, whereas lines that are closer together show a slower progression. The direction of diffusion is also given by the edges of the contour lines. The model located the wave of disease dispersal in the central part of the region and included the index case and autochthonous case. The bulk of the outbreak unfolded within 90 days, spreading mainly to the southwestern and northern parts of the capital city. During this time, the maximum radial distance traveled was 9.4 km. A slower diffusion was predicted toward the northeast and southern part of the region. However, the limitation of the method resulting from edge effects determines that the best area for prediction is the central one.
To visualize the local diffusion of CHIKV at each location, we drew the vector field across the modeled surface (Figure 4, panel A). Overall, the model confirms the previous observation of a general trend or corridor of diffusion of chikungunya cases southwest and northeast of the capital city within the first 80 days. After 90 days, the epidemic wave varied its direction and magnitude by location. Although agreeing with the general pattern shown by the trend surface analysis, the resulting kriging Gaussian (selected) model interpolation surface (Figure 4, panel B; Appendix Table 1) predicts a more heterogeneous spread pattern of chikungunya cases by matching the patchy (uneven population density) distribution of human neighborhoods and the road network. In addition, kriging identified a faster propagation of the epidemiologic wave at the southwestern and eastern areas where the model showed its best fit (Appendix Figure 3, panel A) and a slower movement to the northeastern and south-central areas than estimated by the trend surface analysis.
We calculated the virus diffusion velocities for each parish through the empirical method (Table). The mean velocity of disease spread across the state was 82.9 m ± 53.6 m/day, and overall, the pattern of diffusion of CHIKV was highest in the suburban and rural settlements near the capital city. However, the observed velocities varied significantly by location (n = 735; p<0.05). For instance, the parishes at the center of the capital (San Jose, Catedral, Candelaria, San Blas, Santa Rosa) showed velocities <60 m/day, whereas in the remaining localities, including both rural and suburban towns, the speed was >60 m/day. The maximum velocity of the outbreak was 483 m/day, measured south of the capital.
Spatiotemporal Clusters of the Epidemic Wave
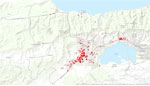
Figure 5
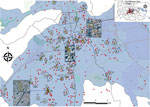
Figure 5. Geographic distribution and significant space–time clustering of reported chikungunya cases identified in a section of the capital city, Valencia (metropolitan area), Carabobo state, Venezuela, June–December 2014. Red dots denote case location;...
Results after multiple space and time parameters testing showed that core clusters remained similar through time (Appendix Figure 4), and the relative risk (RR) within the clusters remained important (RR >1.5) up to 3 weeks (Appendix Figure 5). Using selected critical values, we identified 75 general space–time clusters using Knox analysis (Appendix Table 3; Appendix Figure 6, panel A). These clusters included at least 2 space–time-linked cases and a total of 205 (27.9%) cases that showed a space–time relation. The major accumulation of clusters occurred in the southern and southwestern part of the capital. The earliest cluster (cluster 7; Figure 5) was located in the west-central part of the capital and comprised 3 cases, including the index case. From this cluster, the average distance from each case to the index case was 32 m, and the cases were reported within 25 days after the index case. In addition, the major cluster (cluster 57, 12 cases) was located in the west-central area of the capital 4 km from the index case (Figure 5). The cases belonging to this cluster occurred within 9 days (1.3 cases per day); these cases occurred an average of 70 days (range 69–77 days) after the index case (Appendix Table 3). The median time between the first notified case (symptom onset) and the last case within a cluster was 9 days (range 3–18 days). Furthermore, the average distance between cases within the clusters was 75.2 m ± 25.6 m (range 110.6–39.2 m) (Appendix Table 4). Furthermore, the baseline velocity in Carabobo State was similar to the average velocity within the clusters (69.9 ± 34.4 m/day). These results agree with IKT findings, where the temporal intervals with the strongest spatial clustering and RR occurred at 1–7 days and 25–150 m (Appendix Figures 7, 8).
We described and quantified the spatial and temporal events that followed the introduction and explosive propagation of CHIKV into an immunologically naive population living in the urban north-central region of Venezuela during 2014. The main epidemic curve developed within 5 months, with a maximum value of the estimate of R0 = 3.7 by epidemiologic week 12. The speed of disease diffusion was greatest during the first 90 days, and the spatial spread was heterogeneous following mostly a southwest spatial corridor at a variable local rate of diffusion across the landscape. The radial spread traveled distance was 9.4 km at a mean velocity of 82.9 m/day. The chikungunya epidemic showed spatiotemporal aggregation predominantly south of the capital city, where conditions for human–vector contact are favorable.
The temporal dynamics here described, R0 and its time variable form Rt, suggest high transmissibility of CHIKV in this population. These results agree with previous CHIKV introductions into naive populations (29–31) and with the 2014 predicted values for the mid-latitude countries (R0 = 4–7) of the Americas (31). High values of R0 are also described during first introduction outbreaks of other Aedes mosquito–borne pathogens, such as DENV in Chile (R0 = 27.2) (32) and Zika virus in Brazil (R0 = 1.5–6) (33) and French Polynesia (34). Yet, overall R0 estimates for dengue are ≈2–6 (35). The similarity between the R0 of CHIKV, DENV, and Zika virus infections, all transmitted by the same main vector, the Ae. aegypti mosquito, strongly suggests that the major factor driving the exponential increase of the epidemic curve of arboviruses in naive populations is the transmission efficiency of the vector.
Spatially, trend surface and kriging analyses showed a primary wave of disease spread within the first 80 days in the most likely area of transmission (the southwestern center of Valencia), whereas a second wave at 90 days showed the spread of cases toward the southern, western, and northern areas. This sequential pattern is similar to that of dengue, where transmission within neighborhoods most likely is driven by mosquito presence or abundance and/or short-distance movement of viremic hosts (36–38), whereas long-distance dissemination is probably generated by human mobility patterns through main roads and motorways. Both movements powerfully affected disease transmission (39,40). Moreover, population density modulates the chance of vector–host contact (30,41), a fact reflected in the variation of calculated velocities across different spatial points and the increased diffusion speed of the epidemic toward the southernmost populated area.
Although CHIKV was introduced into a naive population in Venezuela, the distribution of cases was not random but aggregated into 75 significant space–time clusters, indicating an increased likelihood of vector–host contact. The area with most clusters, the southern part of Valencia city, is characterized by densely populated neighborhoods, lower socioeconomic status, and crowded living conditions. Similar factors increased the risk for dengue transmission and clustering (hot spots) in highly endemic urban areas of Venezuela (42). Poverty and human behavior fostering potential mosquito breeding sites (such as storing water at home) were linked with a greater risk for dengue (42,43). In Venezuela, long-lasting deficits in public services, such as frequent and prolonged interruptions in water supply and electricity, have become regular in recent years. These inadequacies have obliged residents to store water, maintaining adequate breeding conditions for Aedes vectors during the dry season and throughout the year (44). During the CHIKV epidemic, the proportion of houses infested with Aedes larvae/pupae (house index) in Venezuela was >20% (45). The World Health Organization recommends a house index <5% for adequate vector control (46).
In our study, the average distance among cases within chikungunya clusters was 75 m, which coincided with the reported flying range of urban Ae. aegypti females during mark-release-recapture studies (37,47). Ae. aegypti females have been reported to visit a maximum of 3 houses in a lifetime while not traveling far from their breeding sites (48,49). Thus, the distance traveled by the vector and the number of possible host encounters with an infected vector cannot explain the entire disease epidemic spread. Other factors, such as movement of viremic hosts, a widely distributed vector, and the lack of herd immunity, may play a role, as for DENV, in long-range spread (37).
The lack of entomologic data and estimates of human movement limit our study. We expect that our estimates based on epidemiologic records are accurate because chikungunya is symptomatic in >80% of cases. Likewise, surveillance in Venezuela is based on symptomatic patient reporting by treating doctors.
Our analysis suggests that the epidemic of chikungunya in Venezuela followed a determined geographic course. This propagation was potentiated south and southwest of the study area. Chikungunya is now established in Venezuela, along with other Aedes mosquito–borne infections, such as dengue and Zika. However, further epidemics of these and other reemergent arboviruses (i.e., Mayaro virus [18,50]) are likely to arise. The insights gained in our study will help identify and predict future epidemic waves of upcoming vectorborne infections and quickly define intervention areas and improve outbreak preparedness response in Venezuela and countries with similar settings.
Mr. Lizarazo is a PhD candidate at the University Medical Center Groningen. His research interests are vectorborne diseases and molecular epidemiology. Dr. Vincenti-Gonzalez is a postdoctoral researcher at the University Medical Center Groningen. Her research interests are vectorborne diseases and spatial–temporal dynamics of infectious diseases.
Acknowledgments
We thank Carenne Ludeña for the support and valuable insights regarding the analysis in this research. We thank Jared Aldstadt who kindly shared the R code for the IKT analysis.
This work was supported by the Fondo Nacional de Ciencia y Tecnología e Innovación (FONACIT), grant 201100129, 20130020; and by the Department of Medical Microbiology and Infection Prevention, University Medical Center Groningen (UMCG), University of Groningen, Groningen, the Netherlands. E.L. and M.V.-G. received the Abel Tasman Talent Program grant from the UMCG, University of Groningen, Groningen, the Netherlands. M.E.G. received a travel grant from the Netherlands Organization for Scientific Research (grant no. 040.11.590/2129), the Netherlands, 2017.
References
- Weaver SC, Forrester NL. Chikungunya: Evolutionary history and recent epidemic spread. Antiviral Res. 2015;120:32–9. DOIPubMedGoogle Scholar
- Patterson J, Sammon M, Garg M. Dengue, Zika and chikungunya: emerging arboviruses in the New World. West J Emerg Med. 2016;17:671–9. DOIPubMedGoogle Scholar
- Robinson MC. An epidemic of virus disease in Southern Province, Tanganyika Territory, in 1952-53. I. Clinical features. Trans R Soc Trop Med Hyg. 1955;49:28–32. DOIPubMedGoogle Scholar
- Powers AM, Logue CH. Changing patterns of chikungunya virus: re-emergence of a zoonotic arbovirus. J Gen Virol. 2007;88:2363–77. DOIPubMedGoogle Scholar
- Wolfe ND, Kilbourn AM, Karesh WB, Rahman HA, Bosi EJ, Cropp BC, et al. Sylvatic transmission of arboviruses among Bornean orangutans. Am J Trop Med Hyg. 2001;64:310–6. DOIPubMedGoogle Scholar
- Chevillon C, Briant L, Renaud F, Devaux C. The Chikungunya threat: an ecological and evolutionary perspective. Trends Microbiol. 2008;16:80–8. DOIPubMedGoogle Scholar
- Higgs S, Vanlandingham D. Chikungunya virus and its mosquito vectors. Vector Borne Zoonotic Dis. 2015;15:231–40. DOIPubMedGoogle Scholar
- Marimoutou C, Ferraro J, Javelle E, Deparis X, Simon F. Chikungunya infection: self-reported rheumatic morbidity and impaired quality of life persist 6 years later. Clin Microbiol Infect. 2015;21:688–93. DOIPubMedGoogle Scholar
- Elsinga J, Gerstenbluth I, van der Ploeg S, Halabi Y, Lourents NT, Burgerhof JG, et al. Long-term chikungunya sequelae in Curaçao: burden, determinants, and a novel classification tool. J Infect Dis. 2017;216:573–81. DOIPubMedGoogle Scholar
- Zeller H, Van Bortel W, Sudre B. Chikungunya: its history in Africa and Asia and its spread to new regions in 2013–2014. J Infect Dis. 2016;214(suppl 5):S436–40. DOIPubMedGoogle Scholar
- Pan American Health Organization. Number of reported cases of chikungunya fever in the Americas—cumulative cases (October 23, 2015) [cited 2017 Aug 20]. http://www.paho.org/hq/index.php?option=com_topics&view=readall&cid=5927&Itemid=40931&lang=en
- Pan American Health Organization. Number of reported cases of chikungunya fever in the Americas- cumulative cases (October 23, 2015) [cited 2017 Aug 20]. http://www.paho.org/hq/index.php?option=com_topics&view=readall&cid=5927&Itemid=40931&lang=en
- Oletta JF. Epidemia de fiebre chikungunya en Venezuela, 2014–2015. Gac Med Caracas. 2016;124:122–37.
- Pimentel R, Skewes-Ramm R, Moya J. [Chikungunya in the Dominican Republic: lessons learned in the first six months] [in Spanish]. Rev Panam Salud Publica. 2014;36:336–41.PubMedGoogle Scholar
- Gérardin P, Guernier V, Perrau J, Fianu A, Le Roux K, Grivard P, et al. Estimating Chikungunya prevalence in La Réunion Island outbreak by serosurveys: two methods for two critical times of the epidemic. BMC Infect Dis. 2008;8:99. DOIPubMedGoogle Scholar
- Schwartz O, Albert ML. Biology and pathogenesis of chikungunya virus. Nat Rev Microbiol. 2010;8:491–500. DOIPubMedGoogle Scholar
- Weaver SC. Arrival of chikungunya virus in the new world: prospects for spread and impact on public health. PLoS Negl Trop Dis. 2014;8:e2921. DOIPubMedGoogle Scholar
- Hotez PJ, Murray KO. Dengue, West Nile virus, chikungunya, Zika-and now Mayaro? PLoS Negl Trop Dis. 2017;11:e0005462. DOIPubMedGoogle Scholar
- Instituto Nacional de Estadística [cited 2017 Nov 18]. http://www.ine.gov.ve
- Wallinga J, Lipsitch M. How generation intervals shape the relationship between growth rates and reproductive numbers. Proc Biol Sci. 2007;274:599–604. DOIPubMedGoogle Scholar
- Nishiura H, Chowell G, Heesterbeek H, Wallinga J. The ideal reporting interval for an epidemic to objectively interpret the epidemiological time course. J R Soc Interface. 2010;7:297–307. DOIPubMedGoogle Scholar
- Coelho FC, de Carvalho LM. Estimating the attack ratio of dengue epidemics under time-varying force of infection using aggregated notification data. Sci Rep. 2015;5:18455. DOIPubMedGoogle Scholar
- Dale M, Fortin M. Spatial analysis: a guide for ecologists. 2nd ed. Cambridge (UK): Cambridge University Press; 2014.
- Wallis K. Use of ranks in one-criterion variance analysis. J Am Stat Assoc. 1952;47:583–621. DOIGoogle Scholar
- Knox EG. The detection of space–time interactions. J R Stat Soc Ser C Appl Stat. 1964;13:25–9.
- Aldstadt J. An incremental Knox test for the determination of the serial interval between successive cases of an infectious disease. Stochastic Environ Res Risk Assess. 2007;21:487–500. DOIGoogle Scholar
- Chan M, Johansson MA. The incubation periods of Dengue viruses. PLoS One. 2012;7:e50972. DOIPubMedGoogle Scholar
- David MR, Lourenço-de-Oliveira R, Freitas RM. Container productivity, daily survival rates and dispersal of Aedes aegypti mosquitoes in a high income dengue epidemic neighbourhood of Rio de Janeiro: presumed influence of differential urban structure on mosquito biology. Mem Inst Oswaldo Cruz. 2009;104:927–32. DOIPubMedGoogle Scholar
- Boëlle P-Y, Thomas G, Vergu E, Renault P, Valleron A-J, Flahault A. Investigating transmission in a two-wave epidemic of Chikungunya fever, Réunion Island. Vector Borne Zoonotic Dis. 2008;8:207–17. DOIPubMedGoogle Scholar
- Yakob L, Clements ACA. A mathematical model of chikungunya dynamics and control: the major epidemic on Réunion Island. PLoS One. 2013;8:e57448. DOIPubMedGoogle Scholar
- Perkins TA, Metcalf CJ, Grenfell BT, Tatem AJ. Estimating drivers of autochthonous transmission of chikungunya virus in its invasion of the americas. PLoS Curr. 2015;7:7.PubMedGoogle Scholar
- Chowell G, Fuentes R, Olea A, Aguilera X, Nesse H, Hyman JM. The basic reproduction number R0 and effectiveness of reactive interventions during dengue epidemics: the 2002 dengue outbreak in Easter Island, Chile. Math Biosci Eng. 2013;10:1455–74. DOIPubMedGoogle Scholar
- Ferguson NM, Cucunubá ZM, Dorigatti I, Nedjati-Gilani GL, Donnelly CA, Basáñez M-G, et al. EPIDEMIOLOGY. Countering the Zika epidemic in Latin America. Science. 2016;353:353–4. DOIPubMedGoogle Scholar
- Nishiura H, Kinoshita R, Mizumoto K, Yasuda Y, Nah K. Transmission potential of Zika virus infection in the South Pacific. Int J Infect Dis. 2016;45:95–7. DOIPubMedGoogle Scholar
- Johansson MA, Hombach J, Cummings DAT. Models of the impact of dengue vaccines: a review of current research and potential approaches. Vaccine. 2011;29:5860–8. DOIPubMedGoogle Scholar
- Waterman SH, Novak RJ, Sather GE, Bailey RE, Rios I, Gubler DJ. Dengue transmission in two Puerto Rican communities in 1982. Am J Trop Med Hyg. 1985;34:625–32. DOIPubMedGoogle Scholar
- Vazquez-Prokopec GM, Kitron U, Montgomery B, Horne P, Ritchie SA. Quantifying the spatial dimension of dengue virus epidemic spread within a tropical urban environment. PLoS Negl Trop Dis. 2010;4:e920. DOIPubMedGoogle Scholar
- Stoddard ST, Forshey BM, Morrison AC, Paz-Soldan VA, Vazquez-Prokopec GM, Astete H, et al. House-to-house human movement drives dengue virus transmission. Proc Natl Acad Sci U S A. 2013;110:994–9. DOIPubMedGoogle Scholar
- Mondini A, de Moraes Bronzoni RV, Nunes SHP, Chiaravalloti Neto F, Massad E, Alonso WJ, et al. Spatio-temporal tracking and phylodynamics of an urban dengue 3 outbreak in São Paulo, Brazil. PLoS Negl Trop Dis. 2009;3:e448. DOIPubMedGoogle Scholar
- Tauil PL. [Urbanization and dengue ecology] [in Portuguese]. Cad Saude Publica. 2001;17(Suppl):99–102. DOIPubMedGoogle Scholar
- Gubler DJ. Dengue, urbanization and globalization: the unholy trinity of the 21st century. Trop Med Health. 2011;39(Suppl):3–11. DOIPubMedGoogle Scholar
- Vincenti-Gonzalez MF, Grillet ME, Velasco-Salas ZI, Lizarazo EF, Amarista MA, Sierra GM, et al. Spatial analysis of dengue seroprevalence and modeling of transmission risk factors in a dengue hyperendemic city of Venezuela. PLoS Negl Trop Dis. 2017;11:e0005317. DOIPubMedGoogle Scholar
- Agha SB, Tchouassi DP, Bastos ADS, Sang R. Assessment of risk of dengue and yellow fever virus transmission in three major Kenyan cities based on Stegomyia indices. PLoS Negl Trop Dis. 2017;11:e0005858. DOIPubMedGoogle Scholar
- Barrera R, Avila J, González-Téllez S. Unreliable supply of potable water and elevated Aedes aegypti larval indices: a causal relationship? J Am Mosq Control Assoc. 1993;9:189–95.PubMedGoogle Scholar
- Grillet ME, Del Ventura F. Transmisión del virus Zika: Patrones y mecanismos eco-epidemiológicos de una arbovirosis. Tribuna del Investigador. 2016;17:42–61.
- World Health Organization. Guidelines for dengue surveillance and mosquito control. WHO regional publication, Western Pacific Education in Action Series, no. 8. Geneva: The Organzation; 1995.
- Harrington LC, Scott TW, Lerdthusnee K, Coleman RC, Costero A, Clark GG, et al. Dispersal of the dengue vector Aedes aegypti within and between rural communities. Am J Trop Med Hyg. 2005;72:209–20. DOIPubMedGoogle Scholar
- Rodhain F, Rosen L. Mosquito vectors and dengue virus-vector relationships. In: Gubler D, Kuno G, editors. dengue and dengue haemorrhagic fever. 1st ed. London (UK): CAB International; 1997. p. 45–60.
- Getis A, Morrison AC, Gray K, Scott TW. Characteristics of the spatial pattern of the dengue vector, Aedes aegypti, in Iquitos, Peru. Am J Trop Med Hyg. 2003;69:494–505. DOIPubMedGoogle Scholar
- Auguste AJ, Liria J, Forrester NL, Giambalvo D, Moncada M, Long KC, et al. Evolutionary and ecological characterization of Mayaro virus strains Isolated during an outbreak, Venezuela, 2010. Emerg Infect Dis. 2015;21:1742–50. DOIPubMedGoogle Scholar
Figures
Table
Cite This ArticleOriginal Publication Date: February 28, 2019
1These authors contributed equally to this article.
2These authors contributed equally to this article.
Table of Contents – Volume 25, Number 4—April 2019
| EID Search Options |
|---|
|
|
|
|
|
|
Please use the form below to submit correspondence to the authors or contact them at the following address:
Adriana Tami, Department of Medical Microbiology, University Medical Center Groningen, Hanzeplein 1 (HPC EB80), 9713 GZ Groningen, the Netherlands
Top