Skip directly to site content Skip directly to page options Skip directly to A-Z link Skip directly to A-Z link Skip directly to A-Z link
Volume 25, Number 4—April 2019
Research

Spatial Dynamics of Chikungunya Virus, Venezuela, 2014

Erley Lizarazo1, Maria Vincenti-Gonzalez1, Maria E. Grillet2, Sarah Bethencourt, Oscar Diaz, Noheliz Ojeda, Haydee Ochoa, Maria Auxiliadora Rangel, and Adriana Tami2Comments to Author 
Author affiliations: University of Groningen, Groningen, the Netherlands (E. Lizarazo, M. Vincenti-Gonzalez, A. Tami); Universidad Central de Venezuela, Caracas, Venezuela (M.E. Grillet); Universidad de Carabobo, Valencia, Venezuela (S. Bethencourt, A. Tami); Fundación Instituto Carabobeño para la Salud, Carabobo, Venezuela (O. Diaz, N. Ojeda, H. Ochoa, M.A. Rangel)

Main Article

Figure 4

Global and local predicted spreading patterns of chikungunya virus, Carabobo state, Venezuela, 2014. A) Contour map (global scale) of the predicted spreading waves and the velocity vector arrows of each case of chikungunya. The contour map and contour lines in black (traveling waves) were estimated by the best-fit trend surface analysis (third order polynomial model) of time (days) to the first reported case or index case of chikungunya across the landscape. White lines correspond to the road sy

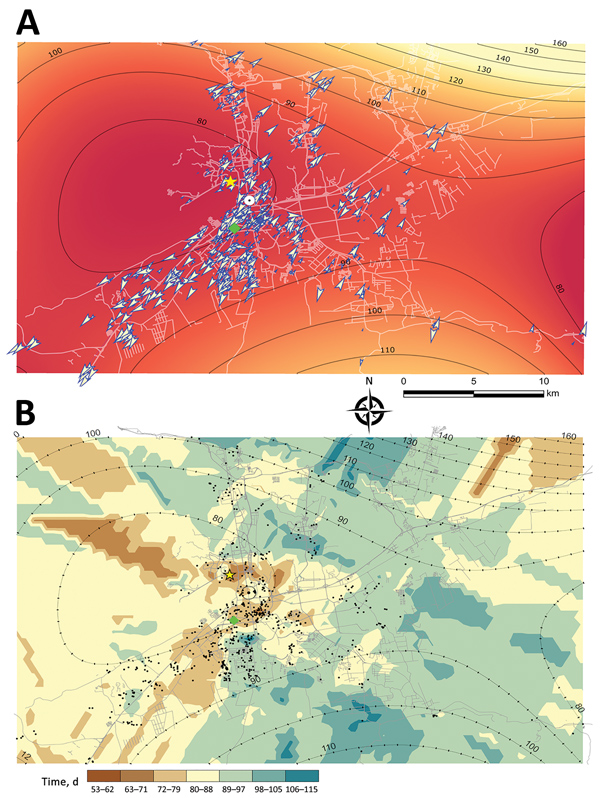
Figure 4. Global and local predicted spreading patterns of chikungunya virus, Carabobo state, Venezuela, 2014. A) Contour map (global scale) of the predicted spreading waves and the velocity vector arrows of each case of chikungunya. The contour map and contour lines in black (traveling waves) were estimated by the best-fit trend surface analysis (third order polynomial model) of time (days) to the first reported case or index case of chikungunya across the landscape. White lines correspond to the road system of the area. The background gradient of color shows the probability of chikungunya virus diffusion according to the prediction of the model: the darker the red, the higher the probability of spread. Each vector (blue outlined arrows) represents the instantaneous velocity derived from the partial, differential equations from the trend surface analysis model (Appendix). B) Spatial prediction map for the ordinary kriging (Gaussian model) interpolation of the time (each color represents a different number of days) of chikungunya spread. Contour lines from trend surface analysis depicted in the kriging surface are shown only for comparison purposes. Yellow star indicates index case; green diamond indicates first autochthonous case.

Main Article

1These authors contributed equally to this article.

2These authors contributed equally to this article.

Page created: March 17, 2019
Page updated: March 17, 2019
Page reviewed: March 17, 2019
The conclusions, findings, and opinions expressed by authors contributing to this journal do not necessarily reflect the official position of the U.S. Department of Health and Human Services, the Public Health Service, the Centers for Disease Control and Prevention, or the authors' affiliated institutions. Use of trade names is for identification only and does not imply endorsement by any of the groups named above.
file_external