Volume 25, Number 4—April 2019
Research
Spatial Dynamics of Chikungunya Virus, Venezuela, 2014
Erley Lizarazo1, Maria Vincenti-Gonzalez1, Maria E. Grillet2, Sarah Bethencourt, Oscar Diaz, Noheliz Ojeda, Haydee Ochoa, Maria Auxiliadora Rangel, and Adriana Tami2
Figure 5
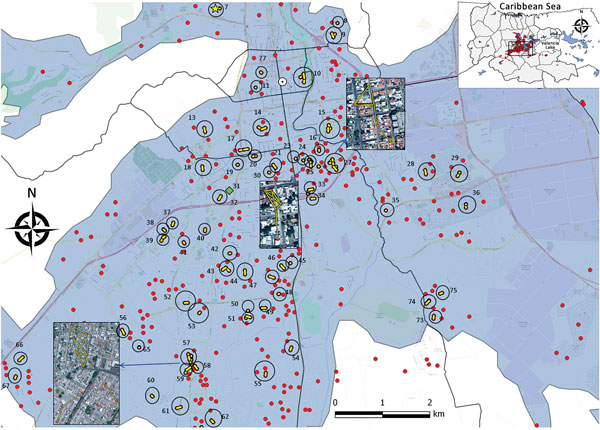
Figure 5. Geographic distribution and significant space–time clustering of reported chikungunya cases identified in a section of the capital city, Valencia (metropolitan area), Carabobo state, Venezuela, June–December 2014. Red dots denote case location; black outlined circles identify a significant space–time cluster; yellow lines show the interaction between cases (time–space link). The analysis was performed using 100 m as clustering distance and 3 weeks as time window. Significance level for local clustering detection was p<0.05. Inset depicts the geographic location of Carabobo; black rectangle indicates highlighted study area.
1These authors contributed equally to this article.
2These authors contributed equally to this article.
Page created: March 17, 2019
Page updated: March 17, 2019
Page reviewed: March 17, 2019
The conclusions, findings, and opinions expressed by authors contributing to this journal do not necessarily reflect the official position of the U.S. Department of Health and Human Services, the Public Health Service, the Centers for Disease Control and Prevention, or the authors' affiliated institutions. Use of trade names is for identification only and does not imply endorsement by any of the groups named above.