Volume 25, Number 6—June 2019
Perspective
Using Big Data to Monitor the Introduction and Spread of Chikungunya, Europe, 2017
Joacim Rocklöv , Yesim Tozan, Aditya Ramadona, Maquines O. Sewe, Bertrand Sudre, Jon Garrido, Chiara Bellegarde de Saint Lary, Wolfgang Lohr, and Jan C. Semenza
Figure 5
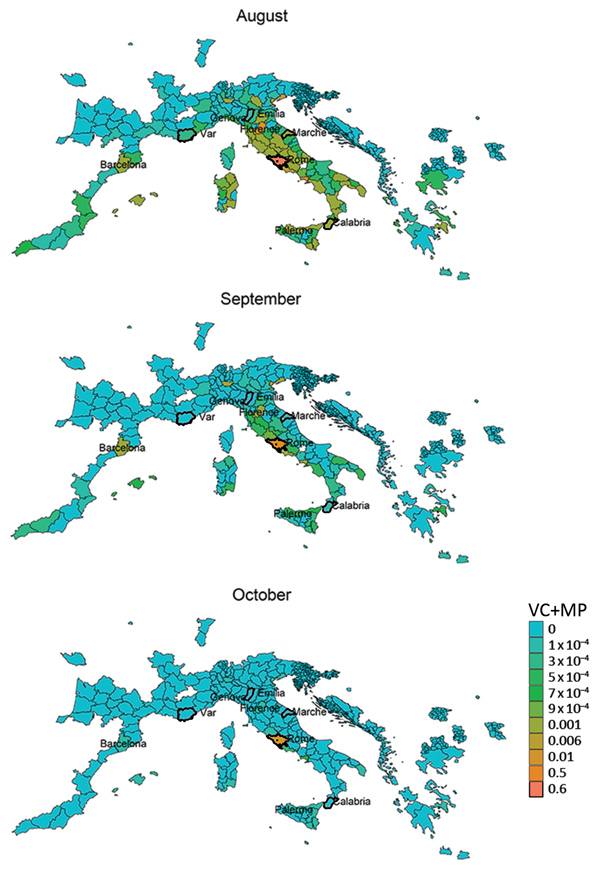
Figure 5. Estimated areas of risk for chikungunya spread from the outbreak areas of Anzio and Rome in the Lazio region, Italy, based on combined VC and estimates, August–October 2017. Heavy outlines indicate the outbreak areas. MP, mobility proximity; VC, vectorial capacity.
Page created: May 20, 2019
Page updated: May 20, 2019
Page reviewed: May 20, 2019
The conclusions, findings, and opinions expressed by authors contributing to this journal do not necessarily reflect the official position of the U.S. Department of Health and Human Services, the Public Health Service, the Centers for Disease Control and Prevention, or the authors' affiliated institutions. Use of trade names is for identification only and does not imply endorsement by any of the groups named above.