Volume 27, Number 1—January 2021
Research
Estimating the Force of Infection for Dengue Virus Using Repeated Serosurveys, Ouagadougou, Burkina Faso
Jacqueline K. Lim , Mabel Carabali, Tansy Edwards, Ahmed Barro, Jung-Seok Lee, Desire Dahourou, Kang Sung Lee, Teguewende Nikiema, Mee Young Shin, Emmanuel Bonnet, Therese Kagone, Losseni Kaba, Suk Namkung, Paul-André Somé, Jae Seung Yang, Valéry Ridde, In-Kyu Yoon, Neal Alexander, and Yaro Seydou
Figure 1
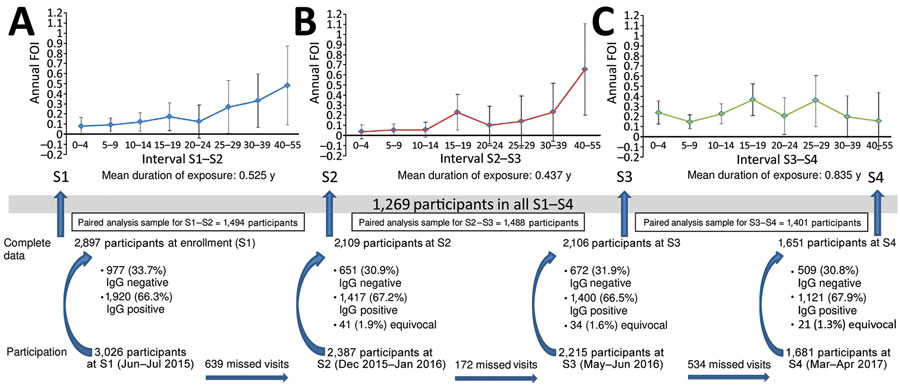
Figure 1. Flowchart of participant enrollment and graphs of annual force of infection rates during a rainy season (A), a nonrainy season (B), and the 2016 dengue outbreak (C) in study of force of infection for dengue virus, Ouagadougou, Burkina Faso, June–July 2015. Labels along x-axes (e.g., 0–4) indicate age ranges in years. Error bars indicate 95% CIs. To be considered complete, records had to contain lab results and basic demographic information. Seroconversion rates in the paired analyses were based solely on results from one survey to the next (e.g., S2–S3). Dengue serostatus in previous or subsequent surveys was not considered. S, serosurvey.
Page created: September 23, 2020
Page updated: December 21, 2020
Page reviewed: December 21, 2020
The conclusions, findings, and opinions expressed by authors contributing to this journal do not necessarily reflect the official position of the U.S. Department of Health and Human Services, the Public Health Service, the Centers for Disease Control and Prevention, or the authors' affiliated institutions. Use of trade names is for identification only and does not imply endorsement by any of the groups named above.