Volume 27, Number 1—January 2021
Research
Intrafamilial Exposure to SARS-CoV-2 Associated with Cellular Immune Response without Seroconversion, France
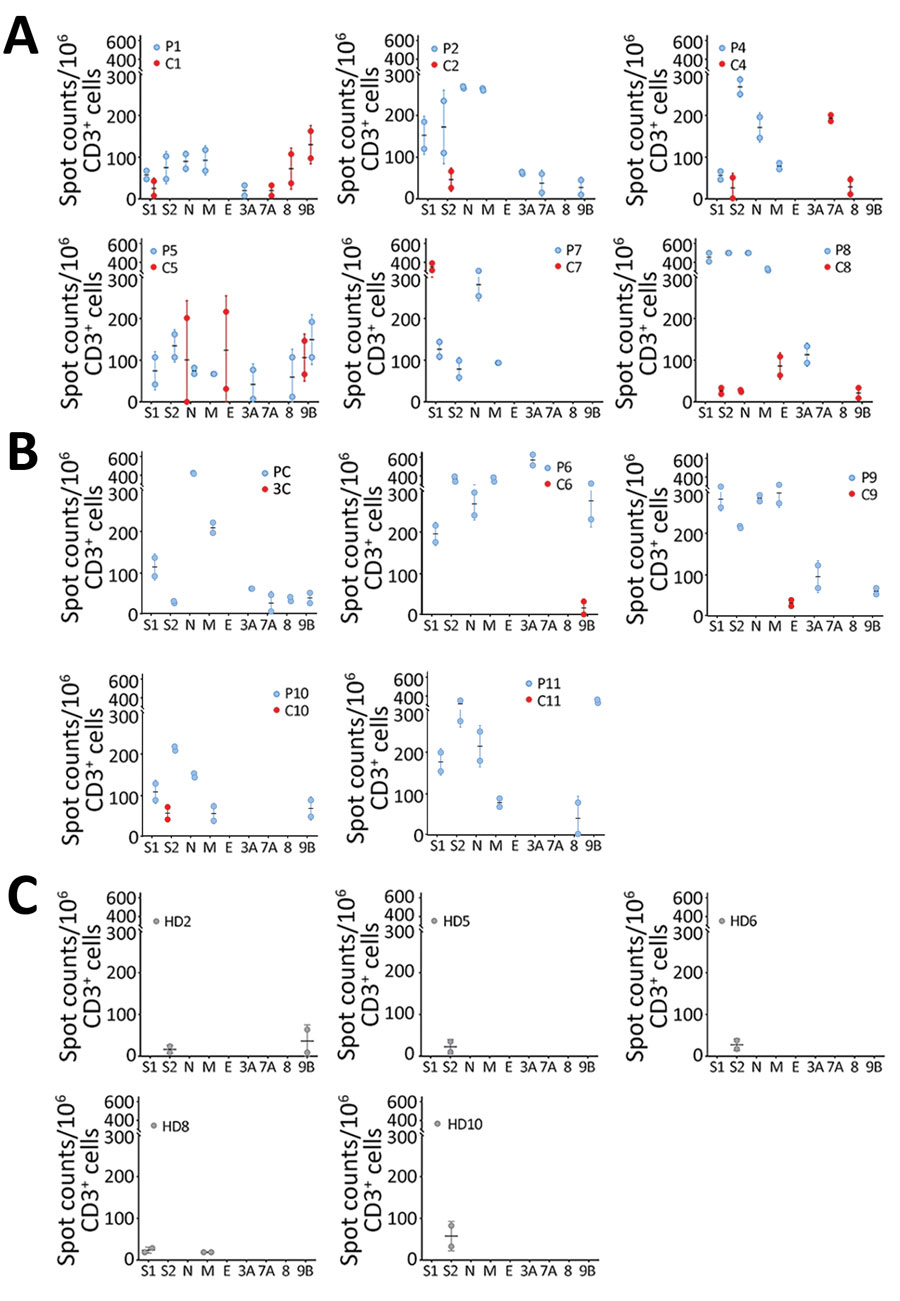
Figure 1

Figure 1. SARS-CoV-2–specific T-cell response patterns in index patients, contacts, and unexposed healthy donors in study of intrafamilial exposure to SARS-CoV-2, France. A, B) Spot counts of SARS-CoV-2–specific T cells measured by interferon-gamma (IFN-γ) ELISPOT assay are shown for 11 couples, each including 1 confirmed coronavirus disease case (P) and 1 SARS-CoV-2 seronegative symptomatic (A) or asymptomatic (B) contact (C). C) Spot counts of IFN-γ–producing T cells in response to SARS-CoV-2 antigens are shown for the 5 out of the 10 controls (HD) tested who displayed detectable T-cell responses. All experiments were performed in duplicate. Data are shown as means and standard deviations of spots counts of IFN-γ–producing T cells per 1 million CD3+ cells. Each dot represents a single measured value. Blue dots correspond to T-cell responses detected in index patients, red dots correspond to those detected in contacts and gray dots to those found in healthy donors. The x-axis represents the SARS-CoV-2 antigens spanned by the peptide pools used in ELISPOT assays: the N-terminal and C-terminal regions of SARS-CoV-2 spike glycoprotein (S1 and S2, respectively); the N, M, and E proteins; and the accessory proteins 3A, 7A, 8, and 9B. C, contact; E, envelope small membrane protein; HD, healthy blood donor (control); M, membrane protein; N, nucleoprotein; P, index patient; SARS-CoV-2, severe acute respiratory syndrome coronavirus 2.