Volume 27, Number 1—January 2021
Research
Recency-Weighted Statistical Modeling Approach to Attribute Illnesses Caused by 4 Pathogens to Food Sources Using Outbreak Data, United States
Figure 2
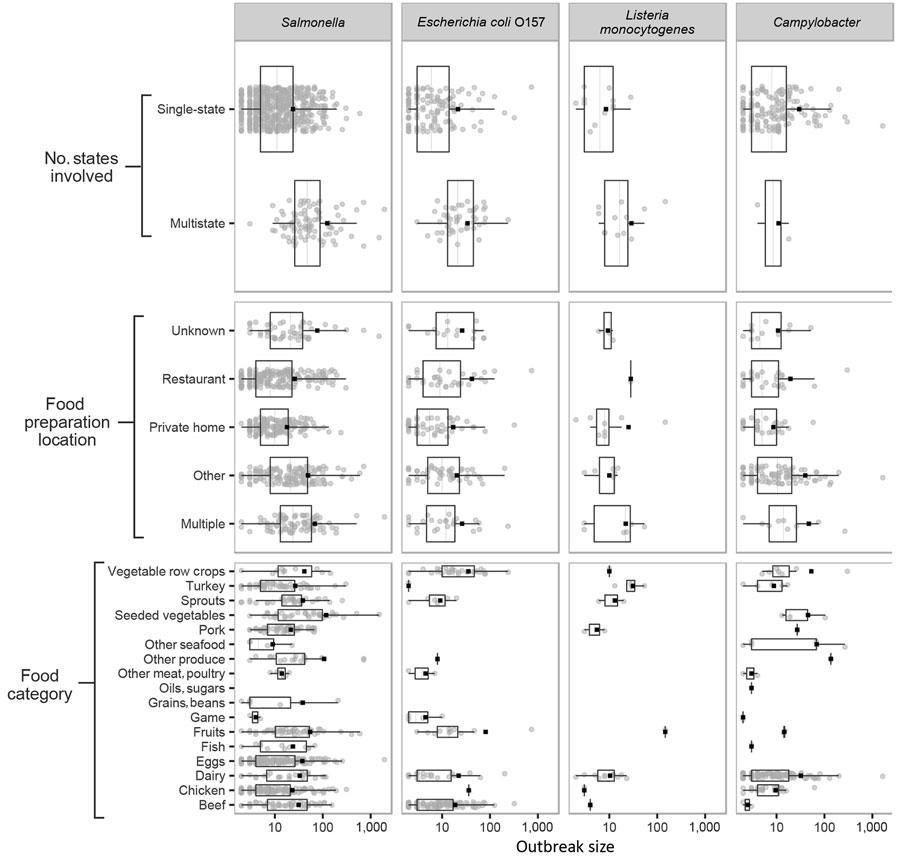
Figure 2. Number of reported illnesses (log scale) for foodborne disease outbreaks caused by a single pathogen and attributable to a single food category, for 3 outbreak characteristics, for Salmonella (A), Escherichia coli O157 (B), Listeria monocytogenes (C), and Campylobacter (D), Foodborne Disease Outbreak Surveillance System, United States, 1998–2012. Each panel displays outbreak size for a given pathogen, grouped by 1 of 3 categorical variables. Each includes a scatterplot of individual outbreaks (indicated by solid circles), the mean (indicated by solid squares), and a boxplot showing median, interquartile range, and minimum and maximum values inside the inner and outer fences (1.5 interquartile range).
1Current affiliation: US Department of Agriculture, Fort Collins, Colorado, USA.
2Current affiliation: US Department of Defense, Bethesda, Maryland, USA.
3Current affiliation: US Department of Veterans Affairs, Palo Alto, California, USA.
4Retired.