Skip directly to site content Skip directly to page options Skip directly to A-Z link Skip directly to A-Z link Skip directly to A-Z link
Volume 27, Number 4—April 2021
Research

Dynamic Public Perceptions of the Coronavirus Disease Crisis, the Netherlands, 2020

Marion de Vries, Liesbeth Claassen, Margreet J.M. te Wierik, Susan van den Hof, Anne E.M. Brabers, Judith D. de Jong, Danielle R.M. Timmermans1, and Aura Timen1
Author affiliations: National Institute for Public Health and the Environment (RIVM), Bilthoven, the Netherlands (M. de Vries, L. Claassen, M.J.M. te Wierik, S. van den Hof, A. Timen); Netherlands Institute for Health Services Research, Utrecht, the Netherlands (A.E.M. Brabers, J.D. de Jong); Maastricht University, Maastricht, the Netherlands (J.D. de Jong); Amsterdam UMC, Amsterdam, the Netherlands (D.R.M. Timmermans); Vrije Universiteit Amsterdam, Amsterdam (A. Timen)

Main Article

Figure 2

Perceptions of COVID-19 in the Netherlands. A) Perceived probability of COVID-19; B) perceived severity of influenza, coronavirus disease, Ebola; C) concerns about own heath; D) concerns about health of family members. Mean values per survey are shown above the graph line. Note that the 95% CIs around the mean estimates could not be shown on the figure because the 95% CIs are very close to the mean estimates (upper values of <mean + 0.1 and lower values of >mean – 0.1). All 95% CIs around the mean estimates are shown in Appendix Table 2. Changes between subsequent surveys, based on generalized estimating equation analyses, are shown below the baselines as β and 95% CIs. The coefficients and 95% CIs shown in Figure 3, panel B, are generalized estimating equation results with perceived severity of coronavirus disease as the dependent variable. COVID-19, coronavirus disease.

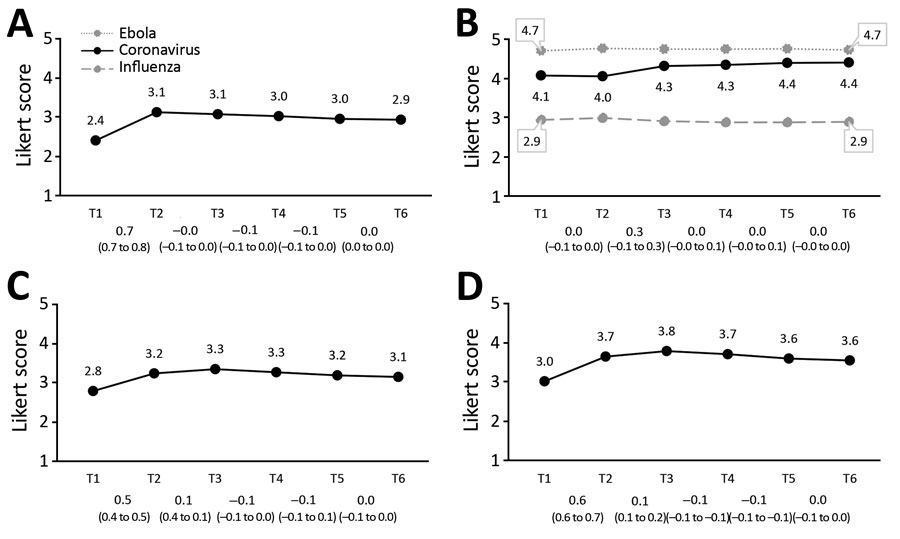
Figure 2. Perceptions of COVID-19 in the Netherlands. A) Perceived probability of COVID-19; B) perceived severity of influenza, coronavirus disease, Ebola; C) concerns about own heath; D) concerns about health of family members. Mean values per survey are shown above the graph line. Note that the 95% CIs around the mean estimates could not be shown on the figure because the 95% CIs are very close to the mean estimates (upper values of <mean + 0.1 and lower values of >mean – 0.1). All 95% CIs around the mean estimates are shown in Appendix Table 2. Changes between subsequent surveys, based on generalized estimating equation analyses, are shown below the baselines as β and 95% CIs. The coefficients and 95% CIs shown in Figure 3, panel B, are generalized estimating equation results with perceived severity of coronavirus disease as the dependent variable. COVID-19, coronavirus disease.

Main Article

1These authors contributed equally to this article.

Page created: January 25, 2021
Page updated: March 22, 2021
Page reviewed: March 22, 2021
The conclusions, findings, and opinions expressed by authors contributing to this journal do not necessarily reflect the official position of the U.S. Department of Health and Human Services, the Public Health Service, the Centers for Disease Control and Prevention, or the authors' affiliated institutions. Use of trade names is for identification only and does not imply endorsement by any of the groups named above.
file_external