Volume 27, Number 4—April 2021
Research
Dynamic Public Perceptions of the Coronavirus Disease Crisis, the Netherlands, 2020
Figure 3
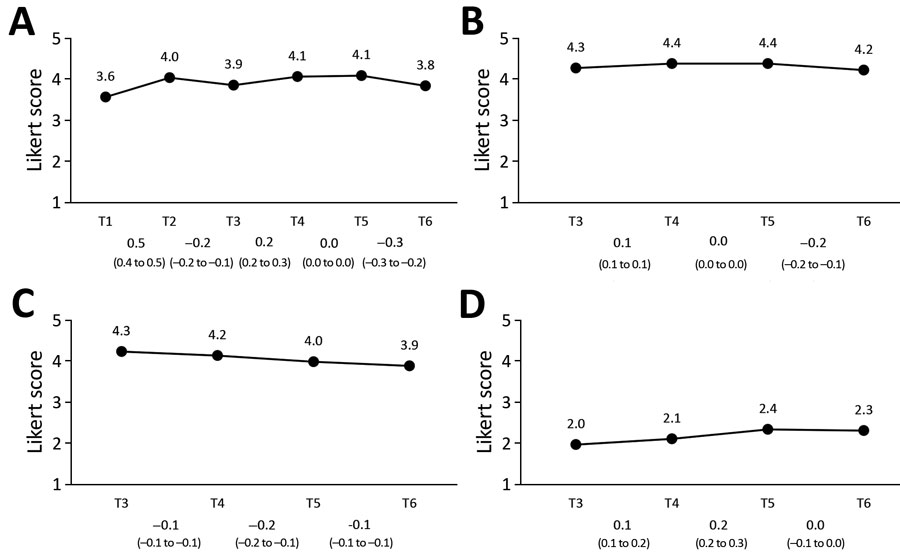
Figure 3. Perceptions of coronavirus disease control measures in the Netherlands. A) Sufficient measures are taken; B) measures are effective; C) most others adhere to measures; D) difficult to adhere to measures. Mean values per survey are shown above the graph line. Note that the 95% CIs around the mean estimates could not be shown in the figure because the 95% CIs are very close to the mean estimates (upper values of <mean + 0.1 and lower values of >mean – 0.1). All 95% CIs around the mean estimates are shown in Appendix Table 2. Changes between subsequent surveys, based on generalized estimating equation analyses, are shown below the baselines as β and 95% CIs.
1These authors contributed equally to this article.
Page created: January 25, 2021
Page updated: March 22, 2021
Page reviewed: March 22, 2021
The conclusions, findings, and opinions expressed by authors contributing to this journal do not necessarily reflect the official position of the U.S. Department of Health and Human Services, the Public Health Service, the Centers for Disease Control and Prevention, or the authors' affiliated institutions. Use of trade names is for identification only and does not imply endorsement by any of the groups named above.