Volume 27, Number 5—May 2021
Research
Serologic Screening of Severe Acute Respiratory Syndrome Coronavirus 2 Infection in Cats and Dogs during First Coronavirus Disease Wave, the Netherlands
Shan Zhao, Nancy Schuurman, Wentao Li, Chunyan Wang, Lidwien A.M. Smit, Els M. Broens, Jaap A. Wagenaar, Frank J.M. van Kuppeveld, Berend-Jan Bosch, and Herman Egberink
Figure 4
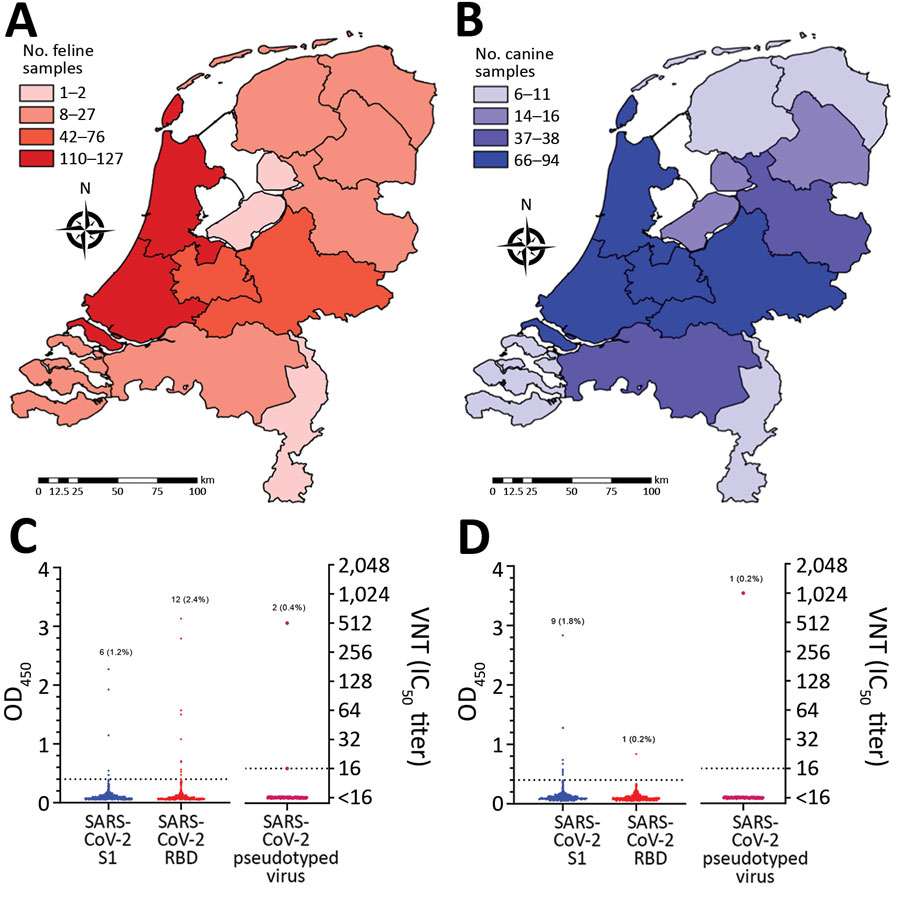
Figure 4. Geographic coverage and serologic analysis of cat (A, C) and dog (B, D) samples of 2020 cohorts for SARS-CoV-2, the Netherlands. A, B) Geographic distribution. Choropleth maps were produced by using ArcGIS version 9.3.1 (Esri, https://www.esri.com). C, D) ELISA and VNT analysis. Number and percentages of positive samples are indicated. Dotted lines indicate positive cutoff levels. Samples that had a VNT >16 were considered positive. IC50, 50% inhibitory concentration; OD, optical density; RBD, receptor-binding domain; S1, spike protein subunit 1; SARS-CoV-2, severe acute respiratory syndrome coronavirus 2; VNT, virus neutralization titer.
Page created: February 21, 2021
Page updated: April 20, 2021
Page reviewed: April 20, 2021
The conclusions, findings, and opinions expressed by authors contributing to this journal do not necessarily reflect the official position of the U.S. Department of Health and Human Services, the Public Health Service, the Centers for Disease Control and Prevention, or the authors' affiliated institutions. Use of trade names is for identification only and does not imply endorsement by any of the groups named above.