Volume 27, Number 5—May 2021
Dispatch
SARS-CoV-2 Serial Interval Variation, Montana, USA, March 1–July 31, 2020
Cite This Article
Citation for Media
Abstract
We report mean severe acute respiratory syndrome coronavirus 2 serial intervals for Montana, USA, from 583 transmission pairs; infectors’ symptom onset dates occurred during March 1–July 31, 2020. Our estimate was 5.68 (95% CI 5.27–6.08) days, SD 4.77 (95% CI 4.33–5.19) days. Subperiod estimates varied temporally by nonpharmaceutical intervention type and fluctuating incidence.
Figure 1
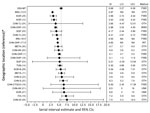
In support of efforts in response to the emergence of severe acute respiratory syndrome coronavirus 2 (SARS-CoV-2), the pathogen causing novel coronavirus disease (COVID-19), the scientific community has attempted to predict its transmission trends, often through disease modeling. However, disease-specific parameter estimates for SARS-CoV-2 vary greatly. These parameters include the serial interval (SI), or the duration between onset of symptoms in connected primary and secondary cases, which is crucial in estimating epidemic reproduction numbers (R0) and assessing the effects of nonpharmaceutical interventions (NPIs) on transmission (1). Recent studies report SARS-CoV-2 SIs ranging from 2.97 to 7.5 days, with estimates representing primarily densely populated and urban settings (Table 1; Figure 1). The rural United States was relatively untouched in early epidemic waves, but major outbreaks followed in subsequent waves, so it is unknown whether rural- and urban-based transmission differ. Our objective was to report and compare SARS-CoV-2 SI values for Montana, USA, a primarily rural population, with other global and urban estimates. The study was defined as a public health surveillance activity by the University of Montana Institutional Review Board.
We acquired COVID-19 data, reported by local health jurisdictions, from the Montana Department of Public Health and Human Services; we obtained 45,102 case records as of November 15, 2020. We examined a subset of cases with symptom onset dates during March 1–July 31, 2020 (n = 4,793), as well as secondary cases resulting from primary infections during that period, regardless of onset date. We selected this period because all reported cases were PCR positive, all NPI stages were represented (pre–shelter-in-place [pre-SIP], shelter-in-place [SIP], and reopening phase 1 and phase 2), and the proportion of identifiable transmission chains among cases was relatively high (March–June 39%–44%; July 11%) compared with later periods (August–November 0%–2%).
We assessed the records to identify all epidemiologic links. We defined links as cases having contact with another reported case, when viral infection through accepted modes of transmission was plausible. Linked records (n = 1,005) were organized into pairs and designated as primary or secondary cases. When appropriate, cases were listed as primaries for multiple secondary cases; however, cases were limited to 1 secondary designation. For some secondary cases, 1 specific primary was not clearly defined. To estimate a serial range in these situations, we assigned upper and lower bounds using the shortest and longest SIs from all possible primaries. We excluded records when we could not determine an epidemiologic link or transmission direction. We identified 583 pairs, with 466 primary and 583 secondary cases.
We gave temporal markers to pairs on the basis of the primary case’s symptom onset date, consistent with forward-looking SIs (2), and grouped them by the corresponding statewide NPI: pre-SIP, March 1–27; SIP, March 28–April 25; phase 1, April 26–May 31; phase 2 (June), June 1–30; and phase 2 (July), July 1–31. We divided phase 2 into 2 subperiods to account for changing incidence trends.
We analyzed data using R version 3.6.2 and the EpiEstim package (3,4). Complying with EpiEstim functional requirements, we assigned pairs with a zero-valued SI an upper bound of 1 day, with lower bounds unchanged (n = 52 pairs). No negative-valued SIs were identified. We excluded pairs with a SI >2 incubation periods (>28 days). We determined that a gamma distribution was most appropriate using the R0 package est.GT function (5). Next, we used EpiEstim estimate_R, with case-pair and daily incidence data, to perform a Bayesian estimation of the SI gamma distribution using Markov chain Monte Carlo specified for the joint posterior sample of possible SI values (6,7).
Figure 2
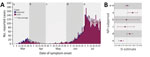
Figure 2. Reported COVID-19 cases and SARS-CoV-2 SI estimates by NPI subperiod, Montana, USA, March 1–July 31, 2020. A) COVID-19 cases, by date of symptom onset. Total cases, 4,793; total pairs, 583. For...
Montana’s overall mean SI estimate was 5.68 (95% CI 5.27–6.08) days (SD 4.77 [95% CI 4.33–5.19] days) (Figure 2). Pre-SIP provided the longest subperiod estimate, 6.84 (95% CI 5.84–7.87) days. The SI shortened during SIP, to 5.54 (95% CI 3.34–8.26) days, and again during phase 1, to 5.26 (95% CI 3.64–7.21) days. However, the SI lengthened during phase 2 (June) to 6.23 (95% CI 5.59–6.85) days, almost reaching pre-SIP levels. Phase 2 (July) demonstrated a sharp reduction to the shortest SI observed, 4.42 (95% CI 3.92–4.93) days. Sensitivity analyses of NPI impact delays resulted in altered subperiod estimates, especially for phase 1 relative to other subperiods (Table 2). Additional sensitivity analyses, comparing forward- and backward-looking SIs, produced vastly dissimilar point estimates and trends.
Analysis of SARS-CoV-2 transmission in Montana during March 1–July 31, 2020, identified a mean SI of 5.68 (95% CI 5.27–6.08) days, falling within the bounds of 16 of 24 published estimates from more urbanized settings across the globe (Table 1; Figure 1). However, an aggregate estimate derived from data spanning multiple outbreak stages may not accurately describe Montana-based transmission because changing contact patterns and environmental influences may cause variation (1,2). Temporal analyses suggest that NPIs influenced transmission patterns, as demonstrated by Montana’s epidemic curve and fluctuating SI values (Figure 2). Ali found that SIs shorten as stricter NPIs are applied (1,8), which our subperiod estimates mostly support. However, phase 2 (July) contradicts the premise, with the shortest subperiod SI and a less restrictive NPI (Table 2). Furthermore, when accounting for NPI impact delays, the alignment falters during phase 2. This difference may occur because Ali did not assess additional epidemic waves, which complicates direct NPI comparisons (1). Park agreed with Ali, while also offering a mathematical proof for the relationship between epidemic growth rates, calculated from incidence data, and forward-looking SIs (2,9). Park showed that as growth rates increase, forward SIs lengthen, and that when incidence decreases (either over time or because of external factors) forward SIs shorten (2). This better describes Montana’s incidence and our subperiod estimates, with NPIs providing context (Figure 2). Increased incidence and longer SIs during pre-SIP and phase 2 (June) stem from nonexistent and relaxed NPIs, whereas decreased incidence and shorter SIs during SIP and phase 2 (July) likely result from stricter NPIs and increased compliance with public health recommendations (e.g., mask wearing and social distancing). Additional data describing social compliance would benefit this interpretation.
The first limitation of this study is that the proportion of cases with identifiable transmission chains was lower during July than in previous periods. Despite this limitation, we felt it was necessary to report an SI for a period experiencing sizable incidence fluctuations. In addition, whereas others have reported negative-valued SIs among 1.2%–14.46% of infector–infectee pairs (10–14), we failed to identify any within our data. This difference could be caused by multiple factors, including incorrectly reported symptom onset dates, misidentified transmission direction between pairs, or both. However, the absence of negative SIs was not unique to our study; 14 of 24 published SI estimates did not include negative-valued pairs (Table 1).
Furthermore, to include pairs with a zero-valued SI, our study required changing their upper range. A sensitivity analysis of the adjustment showed minimal impact to the resulting estimate, whereas another sensitivity analysis, examining zero-valued pairs’ exclusion, returned a substantially elevated estimate. These analyses indicate that nontraditional SIs play key roles in generation time, SI, and R0 studies, especially for SARS-CoV-2, and that inclusive methods should be used when possible.
Our study offers evidence that rural-based SARS-CoV-2 SI estimates are consistent with those describing transmission occurring in urban settings. Furthermore, temporal variations in incidence, which can be caused by NPIs, must be considered when assessing SI distributions and other transmission measures. More period-based analyses of varying NPIs and their effects on transmission dynamics would help corroborate these findings.
Mr. Reed is an epidemiologist with the Office of Epidemiology and Scientific Support at the Montana Department of Public Health and Human Services, where he manages the state’s hospital discharge data and public health data visualization systems. His primary research interests include infectious disease modeling, vectorborne disease, and global health.
Acknowledgments
We thank Montana’s local county and tribal health jurisdictions for their dedication and commitment in responding to the COVID-19 pandemic and for collecting the data used in this study. We also thank the Montana Department of Public Health and Human Services, Communicable Disease Epidemiology Section, for allowing us access to the state’s COVID-19 case investigation data; the authors of the serial interval publications referenced in this paper who kindly responded to our inquiries concerning their studies; as well as Todd Harwell, Curtis Noonan, Erin Semmens, Jeffrey Shaman, Scott Whittenburg, Laura Williamson, and the anonymous reviewers for offering feedback on the manuscript.
This research was supported by the National Institute of General Medical Sciences of the National Institutes of Health (NIH), United States (award no. P20GM130418) and Montana state special revenue funds.
References
- Ali ST, Wang L, Lau EHY, Xu XK, Du Z, Wu Y, et al. Serial interval of SARS-CoV-2 was shortened over time by nonpharmaceutical interventions. Science. 2020;369:1106–9. DOIPubMedGoogle Scholar
- Park SW, Sun K, Champredon D, Li M, Bolker BM, Earn DJD, et al. Forward-looking serial intervals correctly link epidemic growth to reproduction numbers. Proc Natl Acad Sci U S A. 2021;118:
e2011548118 . DOIPubMedGoogle Scholar - R Core Team. R: A language and environment for statistical computing. Vienna: R Foundation for Statistical Computing; 2019 [cited 2021 Feb 11]. https://www.R-project.org
- Cori A. EpiEstim: estimate time varying reproduction numbers from epidemic curves. R package version 2.2–1; 2019 [cited 2021 Feb 11]. https://CRAN.R-project.org/package=EpiEstim.
- Boelle P, Obadia T. R0: estimation of R0 and real-time reproduction number from epidemics. R package version 1.2–6; 2015 [cited 2021 Feb 11]. https://CRAN.R-project.org/package=R0.
- Reich NG, Lessler J, Cummings DAT, Brookmeyer R. Estimating incubation period distributions with coarse data. Stat Med. 2009;28:2769–84. DOIPubMedGoogle Scholar
- Thompson RN, Stockwin JE, van Gaalen RD, Polonsky JA, Kamvar ZN, Demarsh PA, et al. Improved inference of time-varying reproduction numbers during infectious disease outbreaks. Epidemics. 2019;29:
100356 . DOIPubMedGoogle Scholar - Griffin J, Casey M, Collins Á, Hunt K, McEvoy D, Byrne A, et al. Rapid review of available evidence on the serial interval and generation time of COVID-19. BMJ Open. 2020;10:
e040263 . DOIPubMedGoogle Scholar - Ma J, Dushoff J, Bolker BM, Earn DJD. Estimating initial epidemic growth rates. Bull Math Biol. 2014;76:245–60. DOIPubMedGoogle Scholar
- Du Z, Xu X, Wu Y, Wang L, Cowling BJ, Meyers LA. Serial interval of COVID-19 among publicly reported confirmed cases. Emerg Infect Dis. 2020;26:1341–3. DOIPubMedGoogle Scholar
- He X, Lau EHY, Wu P, Deng X, Wang J, Hao X, et al. Temporal dynamics in viral shedding and transmissibility of COVID-19. Nat Med. 2020;26:672–5. DOIPubMedGoogle Scholar
- Mettler SK, Kim J, Maathuis MH. Diagnostic serial interval as a novel indicator for contact tracing effectiveness exemplified with the SARS-CoV-2/COVID-19 outbreak in South Korea. Int J Infect Dis. 2020;99:346–51. DOIPubMedGoogle Scholar
- Prete CA, Buss L, Dighe A, Porto VB, da Silva Candido D, Ghilardi F, et al. Serial interval distribution of SARS-CoV-2 infection in Brazil. J Travel Med. 2021;28:taaa115. DOIGoogle Scholar
- Talmoudi K, Safer M, Letaief H, Hchaichi A, Harizi C, Dhaouadi S, et al. Estimating transmission dynamics and serial interval of the first wave of COVID-19 infections under different control measures: a statistical analysis in Tunisia from February 29 to May 5, 2020. BMC Infect Dis. 2020;20:914. DOIPubMedGoogle Scholar
Figures
Tables
Cite This ArticleOriginal Publication Date: April 15, 2021
Table of Contents – Volume 27, Number 5—May 2021
| EID Search Options |
|---|
|
|
|
|
|
|
Please use the form below to submit correspondence to the authors or contact them at the following address:
Isaiah G. Reed, Montana Department of Public Health and Human Services, 1400 Broadway, Rm A113, PO Box 202951, Helena, MT 59620-2951, USA
Top