Volume 27, Number 5—May 2021
Synopsis
SARS-CoV-2 in Nursing Homes after 3 Months of Serial, Facilitywide Point Prevalence Testing, Connecticut, USA
Figure 2
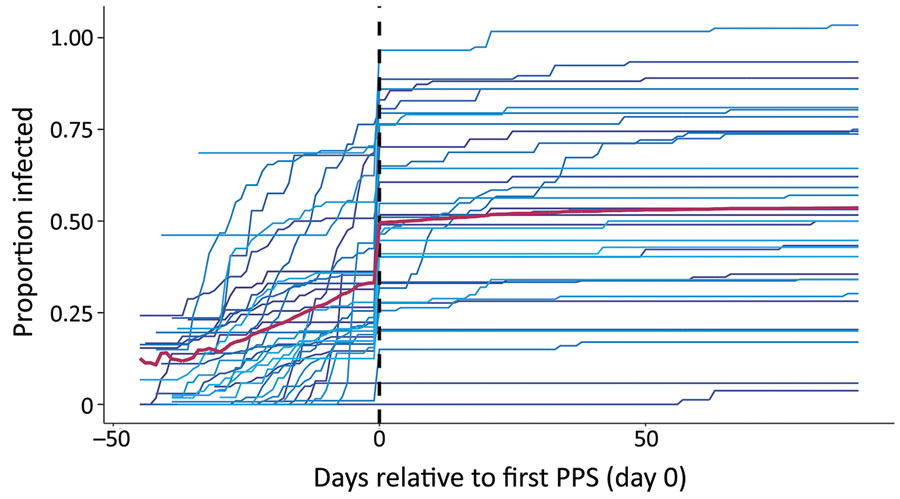
Figure 2. Cumulative proportion of severe acute respiratory syndrome coronavirus 2 (SARS-CoV-2) infections in individual nursing homes over a 16-week study period relative to the first PPS, Connecticut, USA. Each colored line represents a single nursing home in the ≈4 weeks before first PPS and 12 weeks following first PPS. Data were centered for all nursing homes by the date of receipt of results for the first PPS, signified by the dashed vertical line on day 0. Red line indicates average proportion infected of the total study population on each day. The number of residents infected in each nursing home is based on cumulative case counts out of the number ever susceptible to SARS-CoV-2 in the nursing home, or the maximum census value in the study period, to account for resident deaths and transfers since the start of reporting. PPS, point prevalence survey.