Volume 27, Number 5—May 2021
Synopsis
SARS-CoV-2 in Nursing Homes after 3 Months of Serial, Facilitywide Point Prevalence Testing, Connecticut, USA
Hanna Y. Ehrlich, Adora Harizaj, Lauren Campbell, McKenzie Colt, Karen Yuan, Therese Rabatsky-Ehr, Daniel M. Weinberger, Vivian Leung, Linda M. Niccolai, and Sunil Parikh
Figure 3
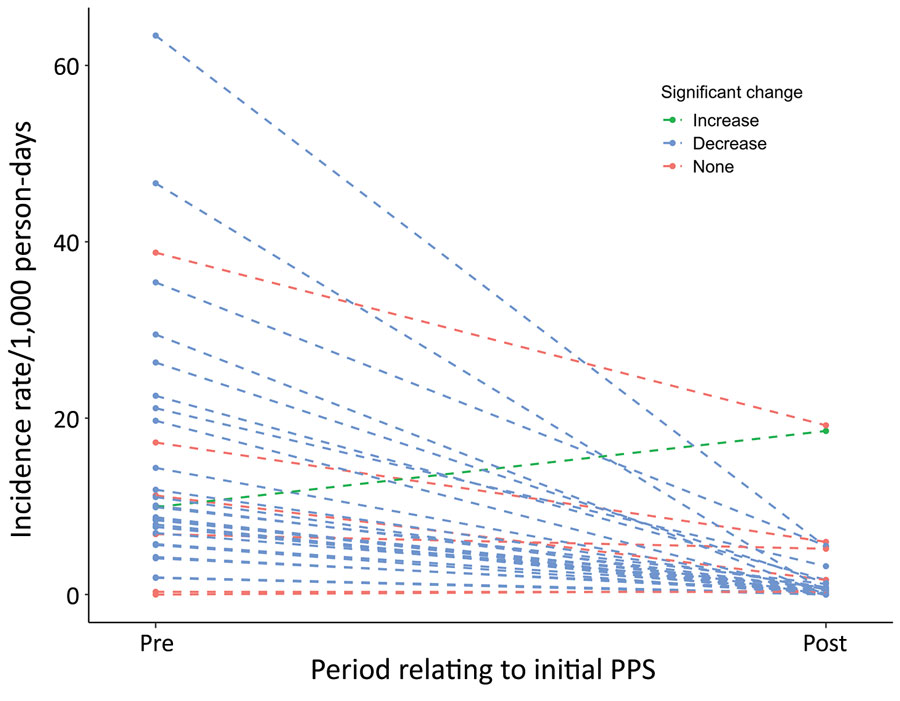
Figure 3. Paired coronavirus disease incidence rate estimates relative to first PPS, Connecticut, USA. Dashed lines represent single nursing homes included in the study. Points represent the incidence in the 4 weeks before the first PPS and 12 weeks following the first PPS, during which additional PPSs were also conducted. Blue indicates significant decreases in incidence for each nursing home over the 2 time periods (α = 0.05); green indicates significant increases; red indicates nonsignificant changes in incidence. PPS, point prevalence survey.
Page created: April 01, 2021
Page updated: April 20, 2021
Page reviewed: April 20, 2021
The conclusions, findings, and opinions expressed by authors contributing to this journal do not necessarily reflect the official position of the U.S. Department of Health and Human Services, the Public Health Service, the Centers for Disease Control and Prevention, or the authors' affiliated institutions. Use of trade names is for identification only and does not imply endorsement by any of the groups named above.