Volume 27, Number 5—May 2021
Synopsis
SARS-CoV-2 in Nursing Homes after 3 Months of Serial, Facilitywide Point Prevalence Testing, Connecticut, USA
Hanna Y. Ehrlich, Adora Harizaj, Lauren Campbell, McKenzie Colt, Karen Yuan, Therese Rabatsky-Ehr, Daniel M. Weinberger, Vivian Leung, Linda M. Niccolai, and Sunil Parikh
Figure 4
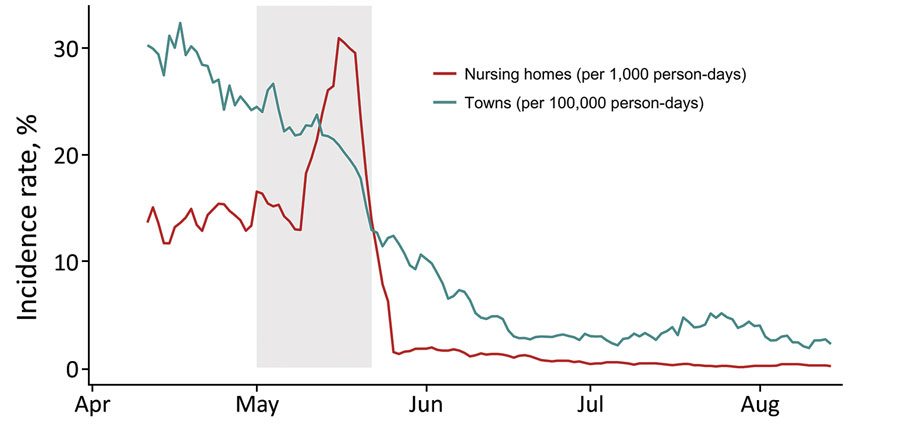
Figure 4. Coronavirus disease incidence rates in nursing homes (cases/1,000 person-days, red) and in towns and cities (cases/100,000 person-days, blue), Connecticut, USA. Incidence rates are aggregated for the 34 nursing homes in this study and 26 towns and cities in which the nursing homes are located; incidence is presented as rolling weekly averages to account for differences in day-of-week reporting. The shaded rectangle shows the time period in which all 34 nursing homes conducted initial PPSs.
Page created: April 01, 2021
Page updated: April 20, 2021
Page reviewed: April 20, 2021
The conclusions, findings, and opinions expressed by authors contributing to this journal do not necessarily reflect the official position of the U.S. Department of Health and Human Services, the Public Health Service, the Centers for Disease Control and Prevention, or the authors' affiliated institutions. Use of trade names is for identification only and does not imply endorsement by any of the groups named above.