Prevalence and Clinical Profile of Severe Acute Respiratory Syndrome Coronavirus 2 Infection among Farmworkers, California, USA, June–November 2020
Joseph A. Lewnard
1
, Ana M. Mora
1, Oguchi Nkwocha, Katherine Kogut, Stephen A. Rauch, Norma Morga, Samantha Hernandez, Marcus P. Wong, Karen Huen, Kristin Andrejko, Nicholas P. Jewell, Kimberly L. Parra, Nina Holland, Eva Harris, Maximiliano Cuevas, Brenda Eskenazi, and
on behalf of the CHAMACOS-Project-19 Study Team2
Author affiliations: University of California, Berkeley, Berkeley, California, USA (J.A. Lewnard, A.M. Mora, K. Kogut, S.A. Rauch, S. Hernandez, M.P. Wong, K. Huen, K. Andrejko, N.P. Jewell, N. Holland, E. Harris, B. Eskenazi); Universidad Nacional, Heredia, Costa Rica (A.M. Mora); Clínica de Salud del Valle de Salinas, Salinas, California, USA (O. Nkwocha, N. Morga, M. Cuevas); London School of Hygiene and Tropical Medicine, London, UK (N.P. Jewell); University of Arizona, Tucson, Arizona, USA (K.L. Parra)
Main Article
Figure 3
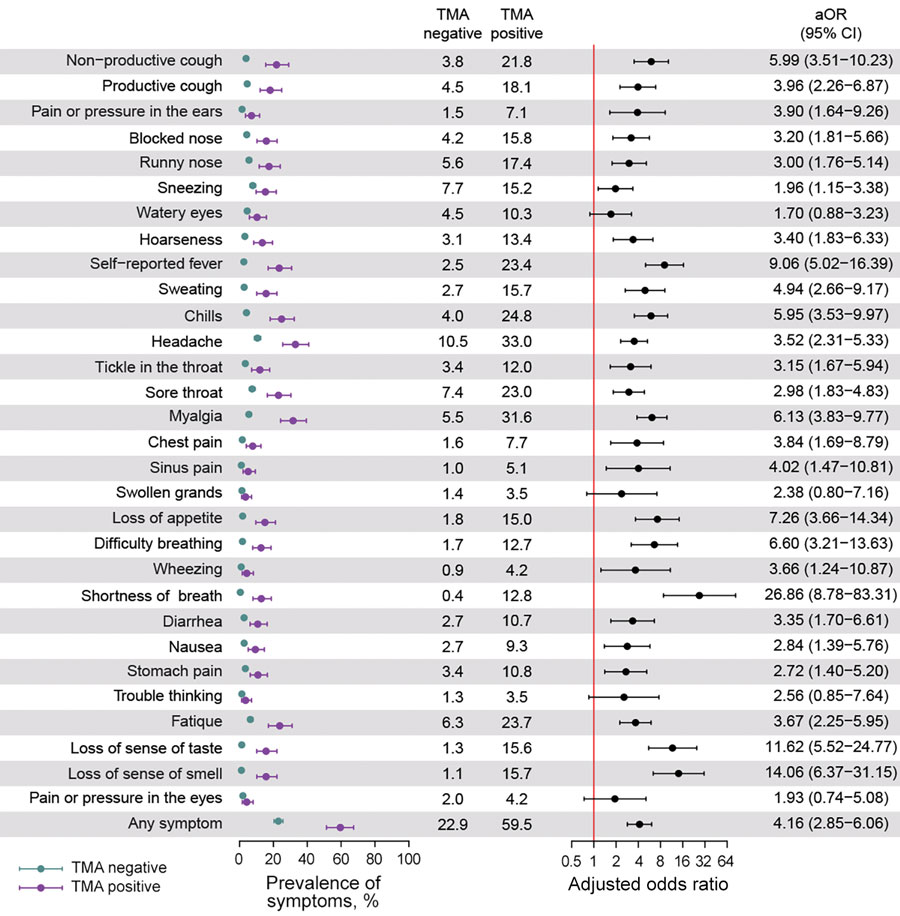
Figure 3. Association of symptoms and current TMA-positive severe acute respiratory syndrome coronavirus 2 (SARS-CoV-2) infection in cross-sectional study of farmworkers, Monterey County, California, USA, July 16–November 30, 2020. Illustration of the prevalence of each symptom during the 2 weeks preceding testing among persons who tested positive and negative for SARS-CoV-2 infection via TMA and the aOR conveying the association of each symptom with current infection. We used logistic regression to determine aORs, controlling for age group, sex, and recruitment venue (i.e., clinic-based or outreach sample). Bars denote 95% CIs around point estimates (circles). aOR, adjusted odds ratio; TMA, transcription-mediated amplification nucleic acid assay.
Main Article
Page created: February 27, 2021
Page updated: April 20, 2021
Page reviewed: April 20, 2021
The conclusions, findings, and opinions expressed by authors contributing to this journal do not necessarily reflect the official position of the U.S. Department of Health and Human Services, the Public Health Service, the Centers for Disease Control and Prevention, or the authors' affiliated institutions. Use of trade names is for identification only and does not imply endorsement by any of the groups named above.