Skip directly to site content Skip directly to page options Skip directly to A-Z link Skip directly to A-Z link Skip directly to A-Z link
Volume 27, Number 5—May 2021
Research

Prevalence and Clinical Profile of Severe Acute Respiratory Syndrome Coronavirus 2 Infection among Farmworkers, California, USA, June–November 2020

Joseph A. Lewnard1Comments to Author , Ana M. Mora1, Oguchi Nkwocha, Katherine Kogut, Stephen A. Rauch, Norma Morga, Samantha Hernandez, Marcus P. Wong, Karen Huen, Kristin Andrejko, Nicholas P. Jewell, Kimberly L. Parra, Nina Holland, Eva Harris, Maximiliano Cuevas, Brenda Eskenazi, and on behalf of the CHAMACOS-Project-19 Study Team2
Author affiliations: University of California, Berkeley, Berkeley, California, USA (J.A. Lewnard, A.M. Mora, K. Kogut, S.A. Rauch, S. Hernandez, M.P. Wong, K. Huen, K. Andrejko, N.P. Jewell, N. Holland, E. Harris, B. Eskenazi); Universidad Nacional, Heredia, Costa Rica (A.M. Mora); Clínica de Salud del Valle de Salinas, Salinas, California, USA (O. Nkwocha, N. Morga, M. Cuevas); London School of Hygiene and Tropical Medicine, London, UK (N.P. Jewell); University of Arizona, Tucson, Arizona, USA (K.L. Parra)

Main Article

Figure 4

Scatter plot of anti-spike IgG reactivity and association with recalled coronavirus disease (COVID-19) symptoms in a cross-sectional study of farmworkers, Monterey County, California, USA, July 16–November 30, 2020. A) Reactivity among persons who reported experiencing or not experiencing various symptoms potentially associated with COVID-19 since December 2019: 1, none of the symptoms listed here; 2, blocked nose (p = 0.027); 3, sweating (p = 0.010); 4, chills (p = 0.013); 5, headache (p = 0.034); 6, tickling in throat (p = 0.029); 7, sinus pain or pressure (p = 0.034); 8, loss of appetite (p<0.001); 9, shortness of breath (p = 0.006); 10, fatigue (p = 0.032); 11, loss of taste (p<0.001); 12, loss of smell (p<0.001). B) Reactivity among persons who reported experiencing or not experiencing various symptoms in the 2 weeks before enrollment (data not shown for symptoms with p>0.1): 1, none of the symptoms listed here; 13, chest pain (p = 0.061); 14, wheezing (p = 0.043); 11, loss of taste (p = 0.037); 12, loss of smell (p = 0.072). C) Reactivity among persons who had a positive or negative severe acute respiratory syndrome coronavirus 2 transcription-mediated amplification (TMA) nucleic acid assay result at the enrollment visit: 15, TMA-positive (p = 0.325); 16 TMA-negative. Reported p values are measured in logistic regression models with the occurrence of each symptom as the outcome and antibody ELISA OD values (log-transformed) as predictors and adjusted for age group and sex. Red lines indicate assay LoD. LoD, limit of detection; OD, optical density.

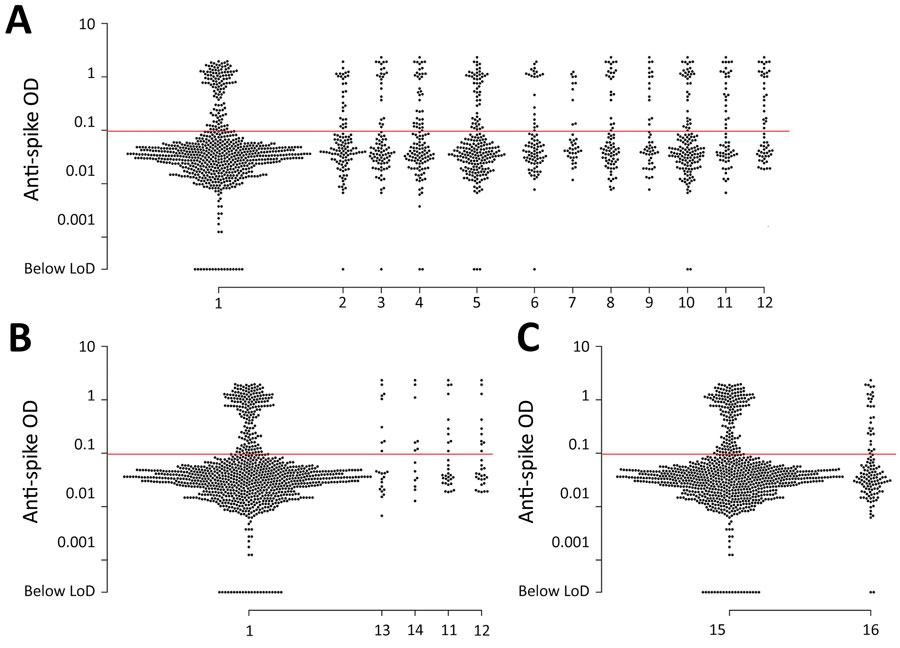
Figure 4. Scatter plot of anti-spike IgG reactivity and association with recalled coronavirus disease (COVID-19) symptoms in a cross-sectional study of farmworkers, Monterey County, California, USA, July 16–November 30, 2020. A) Reactivity among persons who reported experiencing or not experiencing various symptoms potentially associated with COVID-19 since December 2019: 1, none of the symptoms listed here; 2, blocked nose (p = 0.027); 3, sweating (p = 0.010); 4, chills (p = 0.013); 5, headache (p = 0.034); 6, tickling in throat (p = 0.029); 7, sinus pain or pressure (p = 0.034); 8, loss of appetite (p<0.001); 9, shortness of breath (p = 0.006); 10, fatigue (p = 0.032); 11, loss of taste (p<0.001); 12, loss of smell (p<0.001). B) Reactivity among persons who reported experiencing or not experiencing various symptoms in the 2 weeks before enrollment (data not shown for symptoms with p>0.1): 1, none of the symptoms listed here; 13, chest pain (p = 0.061); 14, wheezing (p = 0.043); 11, loss of taste (p = 0.037); 12, loss of smell (p = 0.072). C) Reactivity among persons who had a positive or negative severe acute respiratory syndrome coronavirus 2 transcription-mediated amplification (TMA) nucleic acid assay result at the enrollment visit: 15, TMA-positive (p = 0.325); 16 TMA-negative. Reported p values are measured in logistic regression models with the occurrence of each symptom as the outcome and antibody ELISA OD values (log-transformed) as predictors and adjusted for age group and sex. Red lines indicate assay LoD. LoD, limit of detection; OD, optical density.

Main Article

1These authors contributed equally to this article.

2Members of the CHAMACOS-Project-19 Study Team are listed at the end of this article.

Page created: February 27, 2021
Page updated: April 20, 2021
Page reviewed: April 20, 2021
The conclusions, findings, and opinions expressed by authors contributing to this journal do not necessarily reflect the official position of the U.S. Department of Health and Human Services, the Public Health Service, the Centers for Disease Control and Prevention, or the authors' affiliated institutions. Use of trade names is for identification only and does not imply endorsement by any of the groups named above.
file_external