Volume 28, Number 10—October 2022
Research
Transmission Dynamics and Effectiveness of Control Measures during COVID-19 Surge, Taiwan, April–August 2021
Figure 1
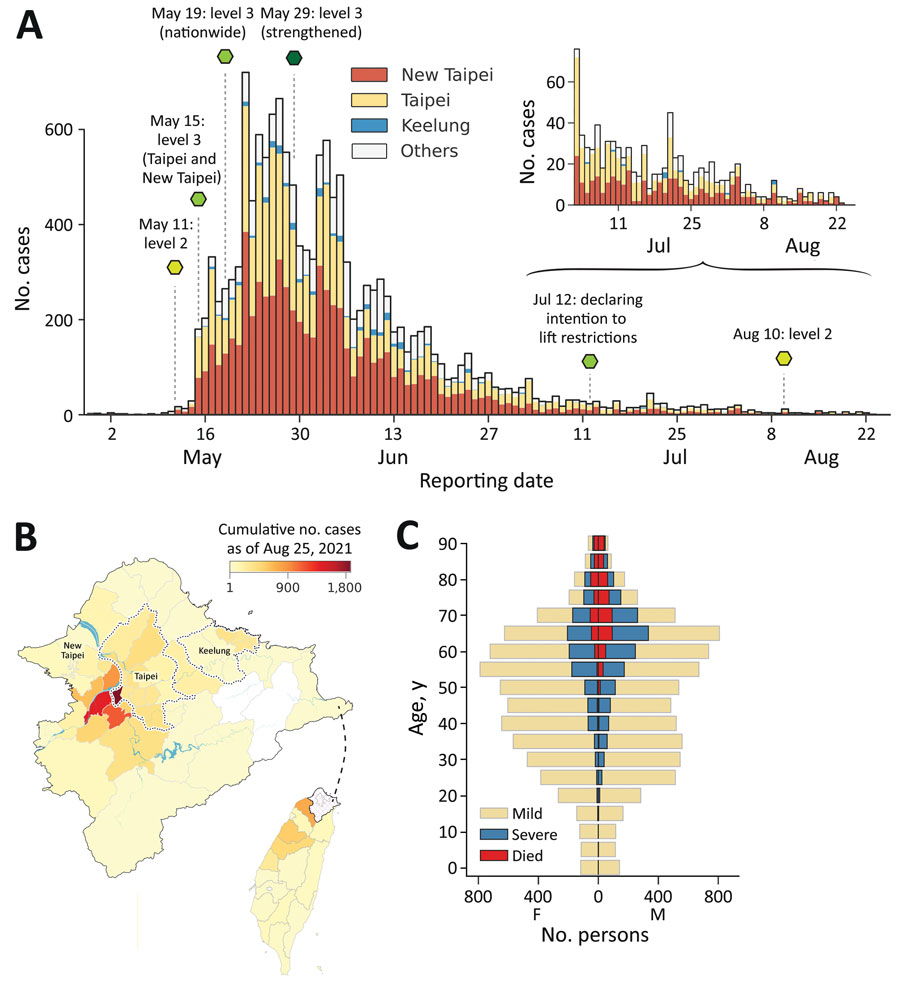
Figure 1. Epidemic wave of COVID-19 in Taiwan, April–August 2021. A) Epidemiologic curve of confirmed COVID-19 cases by reporting date, stratified by geographic area. Dashed lines and hexagons indicate timing and description of major public health and social measures; variation in hexagon colors shows relative strictness of measures, ranging from light to dark green. B) Geographic distribution of cases. The colormap indicates the cumulative number of cases confirmed by August 25, 2021, at district level for Taipei, New Taipei City, and Keelung and at county level for all other areas (indicated in gray in panel A). Inset shows location of enlarged area in Taiwan. C) Age pyramid of confirmed cases specified by known severity status or death. Age and spatial distribution of fatalities is shown in Appendix Figure.