Volume 28, Number 10—October 2022
Research
Transmission Dynamics and Effectiveness of Control Measures during COVID-19 Surge, Taiwan, April–August 2021
Figure 2
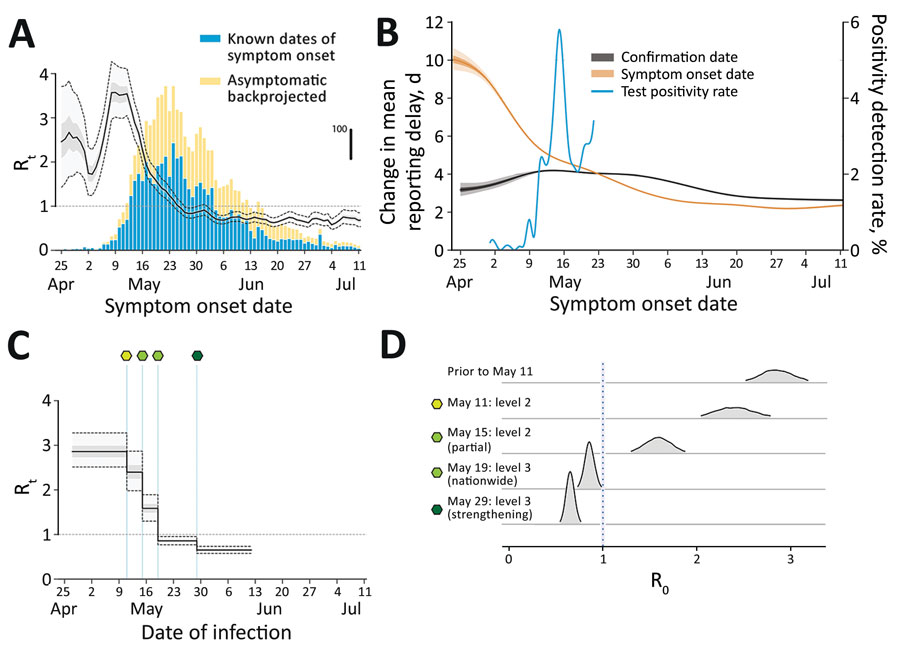
Figure 2. Comparison of Rt inferred by infection date with Rt by symptom onset date during epidemic wave of COVID-19 in Taiwan, April–August 2021. A) Rt by infection date (overlay) is notably shifted to the left compared with symptom onset date. Black line indicates mean; light gray shading indicates interquartile range; dotted lines indicate 95% CI. Bars indicate the nowcasted daily incidence of COVID-19 cases; vertical scale is indicated by thick black line on the right. B) Change in the mean reporting delay, which is the time between symptom onset date and confirmation date, over time, characterized by either the date of symptom onset (orange) or by confirmation date (black). Dark gray shading indicates IQR; light gray shading indicates 95% CI. The blue line indicates the test positivity rate that peaked around May 16 (axis on the right). C, D) The estimated Rt by date of infection, linked to public health and social measures (green-shaded hexagons, as defined in panel D). Rt, effective reproduction number.