Skip directly to site content Skip directly to page options Skip directly to A-Z link Skip directly to A-Z link Skip directly to A-Z link
Volume 28, Number 10—October 2022
Research

Transmission Dynamics and Effectiveness of Control Measures during COVID-19 Surge, Taiwan, April–August 2021

Andrei R. AkhmetzhanovComments to Author , Hao-Yuan Cheng, Natalie M. Linton, Luis Ponce, Shu-Wan Jian, and Hsien-Ho Lin
Author affiliations: National Taiwan University College of Public Health, Taipei, Taiwan (A.R. Akhmetzhanov, L. Ponce, H.-H. Lin); Taiwan Centers for Disease Control, Epidemic Intelligence Center, Taipei (H.-Y. Cheng, S.-W. Jian); Hokkaido University Graduate School of Medicine, Sapporo, Japan (N.M. Linton)

Main Article

Figure 3

Rt by infection date and its link to mobility patterns for epidemic wave of COVID-19 in Taiwan, April–August 2021. A) The change in Rt modeled by a piecewise constant function with a 7-day time window. B) The Rt inferred based on monotonically decreasing basic reproduction number (green) and 6 mobility metrics. C) The temporal dynamics of mobility metrics. D) Comparison of different models based on LOOIC values under a restricted number of mobility metrics (numbers defined in panel B). The legend indicates the set of metrics with highest probability of selection shown by relative weight. Dashed lines contain the region where the change in LOOIC values does not exceed 2 from the minimum, implying a relatively equivalent fit to the data; error bars indicate SD. The blue and yellow bars in A and C are the same as in Figure 2, panel A. LOOIC, leave-one-out information criteria; Rt, effective reproduction number.

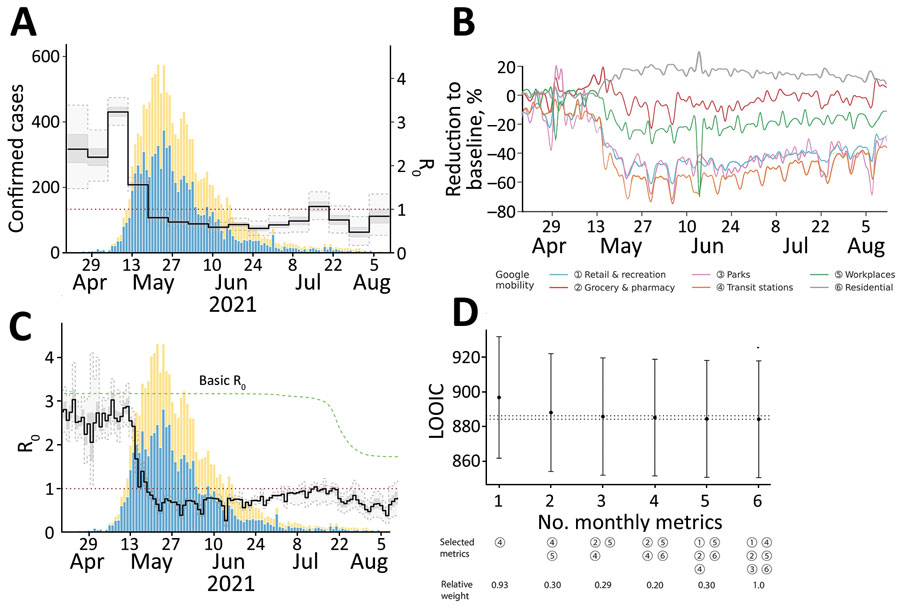
Figure 3. Rt by infection date and its link to mobility patterns for epidemic wave of COVID-19 in Taiwan, April–August 2021. A) The change in Rt modeled by a piecewise constant function with a 7-day time window. B) The Rt inferred based on monotonically decreasing basic reproduction number (green) and 6 mobility metrics. C) The temporal dynamics of mobility metrics. D) Comparison of different models based on LOOIC values under a restricted number of mobility metrics (numbers defined in panel B). The legend indicates the set of metrics with highest probability of selection shown by relative weight. Dashed lines contain the region where the change in LOOIC values does not exceed 2 from the minimum, implying a relatively equivalent fit to the data; error bars indicate SD. The blue and yellow bars in A and C are the same as in Figure 2, panel A. LOOIC, leave-one-out information criteria; Rt, effective reproduction number.

Main Article

Page created: August 23, 2022
Page updated: September 20, 2022
Page reviewed: September 20, 2022
The conclusions, findings, and opinions expressed by authors contributing to this journal do not necessarily reflect the official position of the U.S. Department of Health and Human Services, the Public Health Service, the Centers for Disease Control and Prevention, or the authors' affiliated institutions. Use of trade names is for identification only and does not imply endorsement by any of the groups named above.
file_external