Volume 28, Number 10—October 2022
Research
Transmission Dynamics and Effectiveness of Control Measures during COVID-19 Surge, Taiwan, April–August 2021
Andrei R. Akhmetzhanov , Hao-Yuan Cheng, Natalie M. Linton, Luis Ponce, Shu-Wan Jian, and Hsien-Ho Lin
Figure 4
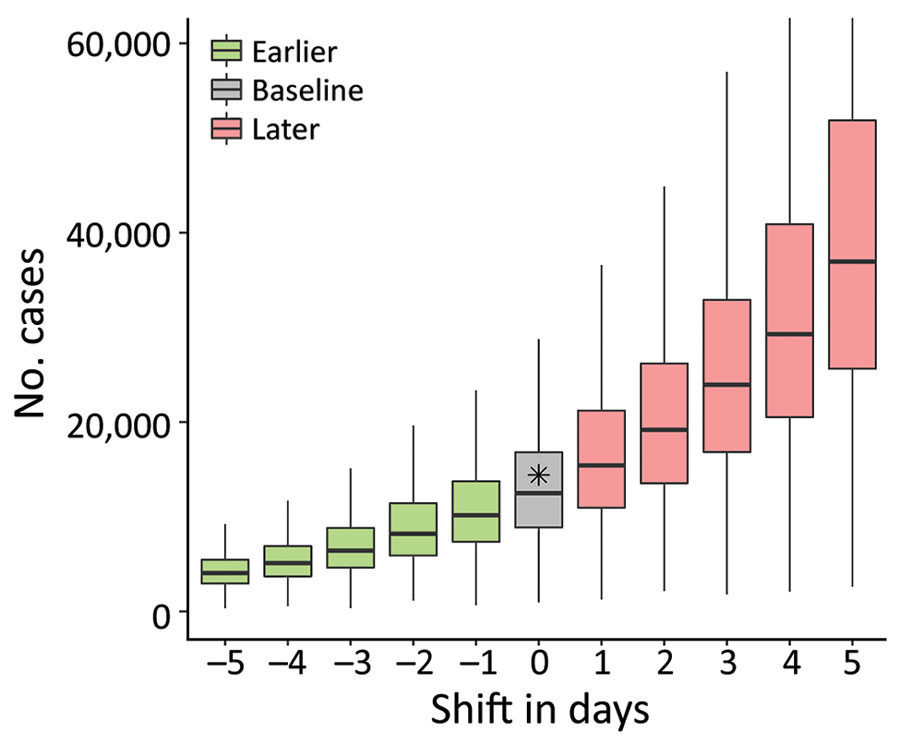
Figure 4. Epidemic wave of COVID-19 in Taiwan, April–August 2021. Model shows impact on epidemic size (by August 14, 2021) of a delay in implementing level 3 prevention measures (Appendix Figure 2) or of implementing them earlier. Horizontal line within boxes indicate medians; box tops and bottoms indicate interquartile ranges; whiskers indicate 95% CIs. Gray box indicates baseline scenario; asterisk indicates observed data.
Page created: August 23, 2022
Page updated: September 20, 2022
Page reviewed: September 20, 2022
The conclusions, findings, and opinions expressed by authors contributing to this journal do not necessarily reflect the official position of the U.S. Department of Health and Human Services, the Public Health Service, the Centers for Disease Control and Prevention, or the authors' affiliated institutions. Use of trade names is for identification only and does not imply endorsement by any of the groups named above.