Skip directly to site content Skip directly to page options Skip directly to A-Z link Skip directly to A-Z link Skip directly to A-Z link
Volume 28, Number 7—July 2022
Research

Measuring Basic Reproduction Number to Assess Effects of Nonpharmaceutical Interventions on Nosocomial SARS-CoV-2 Transmission

George ShirreffComments to Author , Jean-Ralph Zahar, Simon Cauchemez, Laura Temime1, Lulla Opatowski1, and EMEA-MESuRS Working Group on the Nosocomial Modelling of SARS-CoV-22
Author affiliations: Institut Pasteur, Université Paris Cité, Paris, France (G. Shirreff, S. Cauchemez, L. Opatowski); Conservatoire National des Arts et Métiers, Paris (G. Shirreff, L. Temime); University of Versailles Saint-Quentin-en-Yvelines, Montigny-le-Bretonneux, France (G. Shirreff, L. Opatowski); Assistance Publique–Hôpitaux de Paris, Bobigny, France (J.-R. Zahar); PACRI Unit, Paris (L. Temime)

Main Article

Figure 3

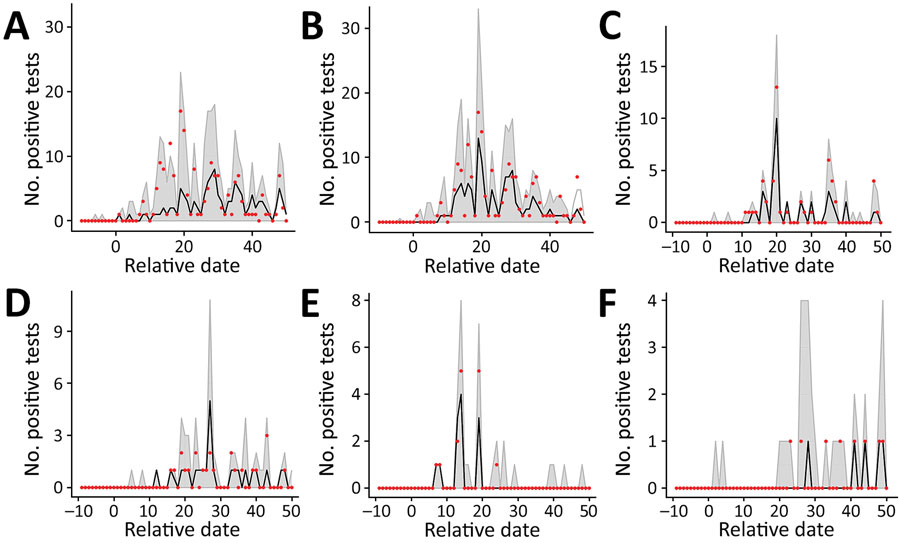
Results of simulated epidemics in a model of nosocomial SARS-CoV-2 transmission using estimated parameters determined on the basis of data from a long-term care facility in France. A) 1-phase model for the whole hospital. B) 2-phase model for the whole hospital. C–F) 1-phase model for individual wards: A2 (C), C0 (D), C2 (E), and C3 (F). Red dots show the observed number of positive tests in the data, black dashed lines indicate the median across that date for all simulations, and gray shading indicates the 95% CI range of the simulated values. Input parameter sets were included if their likelihood fell within the 95% CI relative to the maximum likelihood for 1- and 2-phase models for the whole hospital and individual wards. Estimated parameters are from Tables 1, 2. Extinct epidemics (i.e., those having <3 cumulative cases) were excluded from the distribution.

Figure 3. Results of simulated epidemics in a model of nosocomial SARS-CoV-2 transmission using estimated parameters determined on the basis of data from a long-term care facility in France. A) 1-phase model for the whole hospital. B) 2-phase model for the whole hospital. C–F) 1-phase model for individual wards: A2 (C), C0 (D), C2 (E), and C3 (F). Red dots show the observed number of positive tests in the data, black dashed lines indicate the median across that date for all simulations, and gray shading indicates the 95% CI range of the simulated values. Input parameter sets were included if their likelihood fell within the 95% CI relative to the maximum likelihood for 1- and 2-phase models for the whole hospital and individual wards. Estimated parameters are from Tables 1, 2. Extinct epidemics (i.e., those having <3 cumulative cases) were excluded from the distribution.

Main Article

1These authors were co-principal investigators.

2Members of the workgroup are listed at the end of this article.

Page created: April 28, 2022
Page updated: June 18, 2022
Page reviewed: June 18, 2022
The conclusions, findings, and opinions expressed by authors contributing to this journal do not necessarily reflect the official position of the U.S. Department of Health and Human Services, the Public Health Service, the Centers for Disease Control and Prevention, or the authors' affiliated institutions. Use of trade names is for identification only and does not imply endorsement by any of the groups named above.
file_external