Volume 28, Number 7—July 2022
Dispatch
Use of Human Intestinal Enteroids to Evaluate Persistence of Infectious Human Norovirus in Seawater
Figure 2
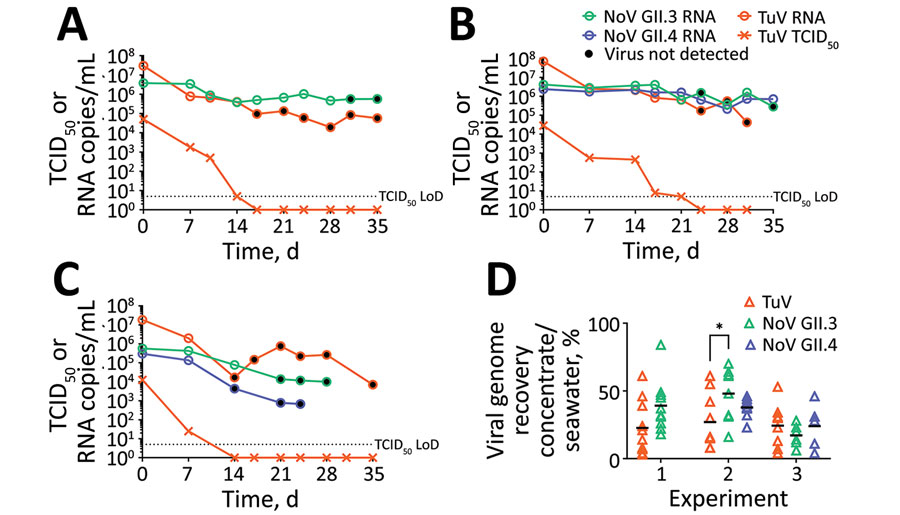
Figure 2. Persistence of viral RNA and infectious norovirus and Tulane virus in seawater. Concentration of viral RNA measured by quantitative reverse transcription PCR (qRT-PCR) in seawater (circles, RNA copies/mL), and of infectious TuV measured by TCID50 (cross, TCID50/mL), during experiments 1 (A), 2 (B), and 3 (C). Open circles mark the detection of infectious virus on HIE cells (human norovirus) or through TCID50 on LLC-MK2 cells (TuV). Black circles indicate the absence of infectious virus detection. Dotted lines indicate the theoretical LoD of the TCID50 assay (5 TCID50/mL). D) Recovery of the viral genome after purification and concentration steps, defined as the ratio (%) of viral genome in the concentrate to that in the seawater, as measured by qRT-PCR, for each virus and time point during the 3 experiments. Black lines indicate the mean per experiment and virus. Recovery was not statistically different between experiments and viruses except for TuV and norovirus GII.3 during experiment 2 (analysis of variance, Sidak’s multiple comparisons test; *p = 0.0318) (GraphPad Prism version 9.2.0, https://www.graphpad.com/scientific-software/prism). LoD, limit of detection; NoV, norovirus; TCID50, 50% median tissue culture infectious dose; TuV, Tulane virus.
1These first authors contributed equally to this article.
2Current affiliation: Centro de Investigaciones Biologicas–Facultade de Bioloxía & CRETUS, Universidade de Santiago de Compostela, Santiago de Compostela, Spain.
3Current affiliation: SECALIM UMR 104 Oniris/Inrae, Nantes, France.