Skip directly to site content Skip directly to page options Skip directly to A-Z link Skip directly to A-Z link Skip directly to A-Z link
Volume 29, Number 10—October 2023
Research

Stability of Monkeypox Virus in Body Fluids and Wastewater

Claude Kwe Yinda1, Dylan H. Morris1, Robert J. Fischer, Shane Gallogly, Zachary A. Weishampel, Julia R. Port, Trenton Bushmaker, Jonathan E. Schulz, Kyle Bibby, Neeltje van Doremalen, James O. Lloyd-Smith, and Vincent J. MunsterComments to Author 
Author affiliations: National Institute of Allergy and Infectious Diseases, Laboratory of Virology, Hamilton, Montana, USA (C.K. Yinda, R.J. Fischer, S. Gallogly, Z.A. Weishampel, J.R. Port, T. Bushmaker, J.E. Schulz, N. van Doremalen, V.J. Munster); University of California, Los Angeles, California, USA (D.H. Morris, J.O. Lloyd-Smith); University of Notre Dame, Notre Dame, Indiana, USA (K. Bibby)

Main Article

Figure 1

Monkeypox virus decay on cotton, polypropylene, and stainless steel under different environmental conditions. A) Regression lines showing predicted exponential decay of virus titers over time compared with measured (directly inferred) virus titers. Points show posterior median of measured titers; black lines show 95% credible intervals. Colored lines indicate random draws from the joint posterior distribution of exponential decay rate (negative of the slope) and intercept (initial virus titer), visualizing range of possible decay patterns for each experimental condition. Blue lines show virus titers during the inferred wet phase, when residual moisture remains visible on the surface; red lines show virus titers during the inferred dry phase, when evaporation has reached a state of quasi-equilibrium. The exact breakpoint was inferred from the data with a previous measurement from the last day of observable liquid. B) Inferred virus half-lives by surface and temperature condition. Dots show the posterior median half-life estimate and black lines show 68% (thick) and 95% (thin) credible intervals. Violin plots show the shape of posterior distribution. Blue show inferred virus half-lives on surfaces during wet phase and red on surfaces during dry phase.

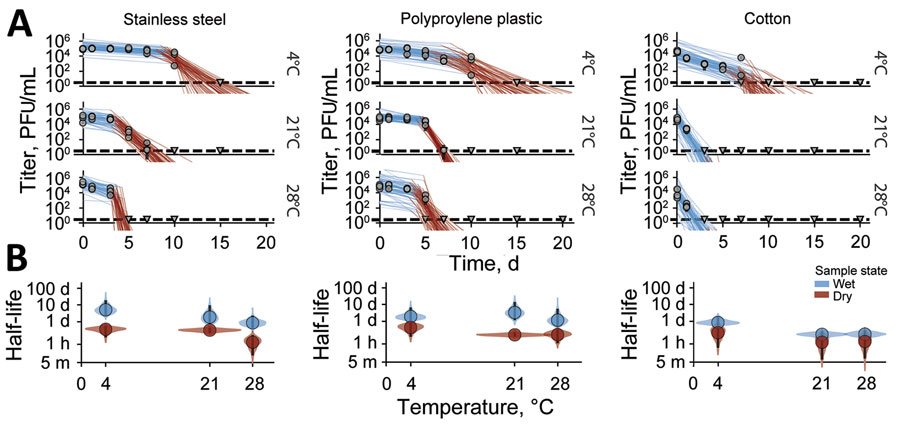
Figure 1. Monkeypox virus decay on cotton, polypropylene, and stainless steel under different environmental conditions. A) Regression lines showing predicted exponential decay of virus titers over time compared with measured (directly inferred) virus titers. Points show posterior median of measured titers; black lines show 95% credible intervals. Colored lines indicate random draws from the joint posterior distribution of exponential decay rate (negative of the slope) and intercept (initial virus titer), visualizing range of possible decay patterns for each experimental condition. Blue lines show virus titers during the inferred wet phase, when residual moisture remains visible on the surface; red lines show virus titers during the inferred dry phase, when evaporation has reached a state of quasi-equilibrium. The exact breakpoint was inferred from the data with a previous measurement from the last day of observable liquid. B) Inferred virus half-lives by surface and temperature condition. Dots show the posterior median half-life estimate and black lines show 68% (thick) and 95% (thin) credible intervals. Violin plots show the shape of posterior distribution. Blue show inferred virus half-lives on surfaces during wet phase and red on surfaces during dry phase.

Main Article

1These authors contributed equally to this study.

Page created: August 03, 2023
Page updated: September 20, 2023
Page reviewed: September 20, 2023
The conclusions, findings, and opinions expressed by authors contributing to this journal do not necessarily reflect the official position of the U.S. Department of Health and Human Services, the Public Health Service, the Centers for Disease Control and Prevention, or the authors' affiliated institutions. Use of trade names is for identification only and does not imply endorsement by any of the groups named above.
file_external