Volume 29, Number 10—October 2023
Research
Stability of Monkeypox Virus in Body Fluids and Wastewater
Figure 4
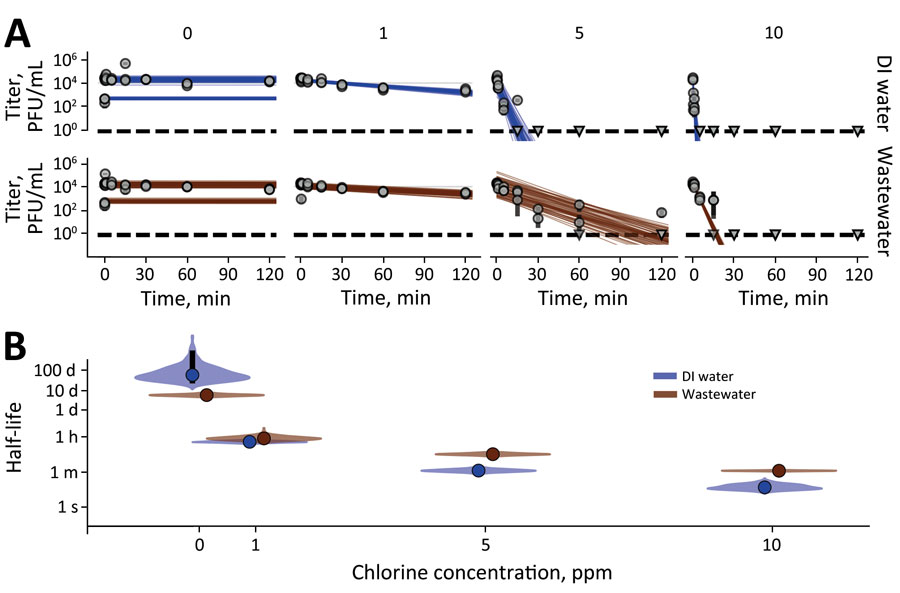
Figure 4. Monkeypox virus exponential decay and decontamination in wastewater and DI water. A) Regression lines showing predicted exponential decay of virus titer over time compared with measured (directly inferred) virus titers. Points show posterior median measured titers; black lines show 95% exponential decay rate (negative of the slope) and intercept (initial virus titer), visualizing range of possible decay patterns for each experimental condition. B) Inferred virus half-lives as a function of free chlorine concentration in parts per million. Violin plots show the shape of the posterior distribution of virus half-lives. Dots show credible intervals for posterior median half-life estimates and black lines show 68% (thick) and 95% (thin) credible intervals. Violin plots show the shape of posterior distribution. Dark blue show inferred virus half-lives in DI water and red in wastewater. DI, deionized; ppms, parts per million.
1These authors contributed equally to this study.