Stability of Monkeypox Virus in Body Fluids and Wastewater
Claude Kwe Yinda
1, Dylan H. Morris
1, Robert J. Fischer, Shane Gallogly, Zachary A. Weishampel, Julia R. Port, Trenton Bushmaker, Jonathan E. Schulz, Kyle Bibby, Neeltje van Doremalen, James O. Lloyd-Smith, and Vincent J. Munster

Author affiliations: National Institute of Allergy and Infectious Diseases, Laboratory of Virology, Hamilton, Montana, USA (C.K. Yinda, R.J. Fischer, S. Gallogly, Z.A. Weishampel, J.R. Port, T. Bushmaker, J.E. Schulz, N. van Doremalen, V.J. Munster); University of California, Los Angeles, California, USA (D.H. Morris, J.O. Lloyd-Smith); University of Notre Dame, Notre Dame, Indiana, USA (K. Bibby)
Main Article
Figure 3
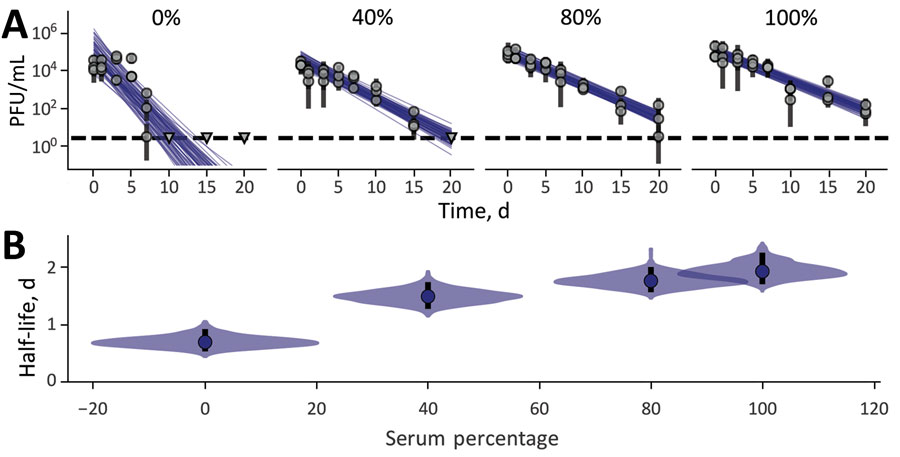
Figure 3. Monkeypox virus decay in different human serum dilutions in Dulbecco modified Eagle medium. A) Regression lines showing predicted exponential decay of virus titers over time compared with measured (directly inferred) virus titers. Points show posterior median measured titers; black lines show 95% credible intervals. Colored lines indicate random draws from joint posterior distribution of the exponential decay rate (negative of the slope) and intercept (initial virus titer), visualizing range of possible decay patterns for each experimental condition. B) Inferred virus half-lives by condition and state. Dots show posterior median half-life estimate and black lines show 68% (thick) and 95% (thin) credible intervals. Violin plots show the shape of posterior distribution of virus half-lives.
Main Article
Page created: August 03, 2023
Page updated: September 20, 2023
Page reviewed: September 20, 2023
The conclusions, findings, and opinions expressed by authors contributing to this journal do not necessarily reflect the official position of the U.S. Department of Health and Human Services, the Public Health Service, the Centers for Disease Control and Prevention, or the authors' affiliated institutions. Use of trade names is for identification only and does not imply endorsement by any of the groups named above.