Association of Persistent Symptoms after Lyme Neuroborreliosis and Increased Levels of Interferon-α in Blood
Sergio A. Hernández, Katarina Ogrinc, Miša Korva, Andrej Kastrin, Petra Bogovič, Tereza Rojko, Keith W. Kelley, Janis J. Weis, Franc Strle, and Klemen Strle

Author affiliations: Tufts University School of Medicine, Boston, Massachusetts, USA (S.A. Hernández, K. Strle); New York State Department of Health, Albany, New York, USA (S.A. Hernández, K. Strle); University Medical Center Ljubljana, Ljubljana, Slovenia (K. Ogrinc, P. Bogovič, T. Rojko, F. Strle}; University of Ljubljana, Ljubljana (M. Korva, A. Kastrin); University of Illinois, Urbana-Champaign, Illinois, USA (K.W. Kelley); University of Utah, Salt Lake City, Utah, USA (J.J. Weis)
Main Article
Figure 4
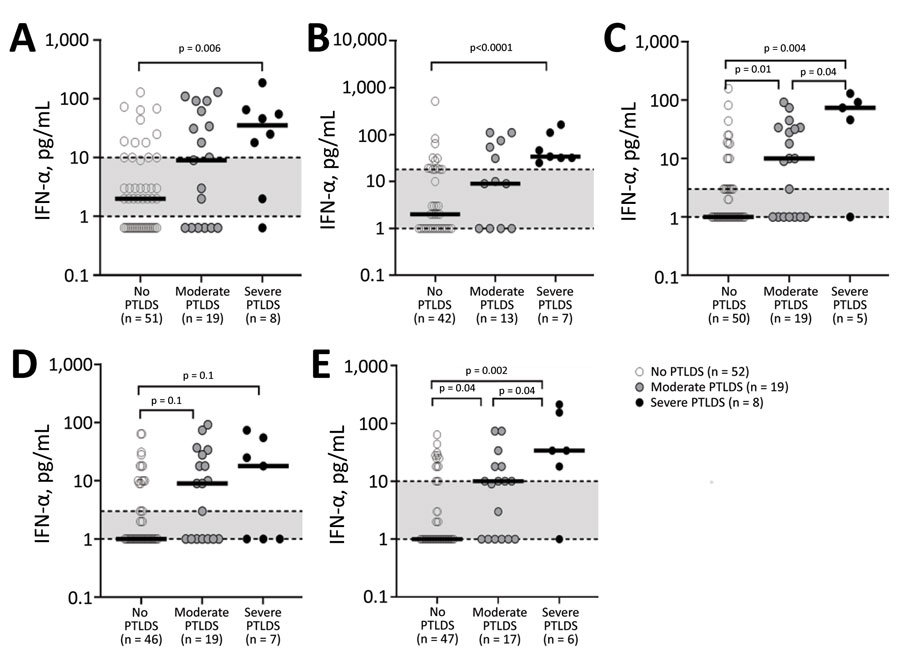
Figure 4. Serum IFN-α levels of individual patients with Lyme neuroborreliosis in Slovenia at each follow-up timepoint according to PTLDS severity in study of association of persistent symptoms after Lyme neuroborreliosis and increased levels of interferon-α in blood. A) T = 0; B) T = 2 wks; C) T = 3 mo; D) T = 6 mo; E) T = 12 mo. Levels of interferon-α in serum for individual patients throughout the 1-year follow-up are shown. Solid black lines symbolize median values, and shaded area between dotted lines indicates interquartile range. Statistical analyses were performed by using nonparametric Mann-Whitney rank-sum tests. Significant p values for each comparison are shown above the corresponding brackets. IFN, interferon; PTLDS, posttreatment Lyme disease symptoms or syndrome.
Main Article
Page created: March 23, 2023
Page updated: May 17, 2023
Page reviewed: May 17, 2023
The conclusions, findings, and opinions expressed by authors contributing to this journal do not necessarily reflect the official position of the U.S. Department of Health and Human Services, the Public Health Service, the Centers for Disease Control and Prevention, or the authors' affiliated institutions. Use of trade names is for identification only and does not imply endorsement by any of the groups named above.