Skip directly to site content Skip directly to page options Skip directly to A-Z link Skip directly to A-Z link Skip directly to A-Z link
Volume 29, Number 6—June 2023
Research

Evolution of Avian Influenza Virus (H3) with Spillover into Humans, China

Jiaying Yang1, Ye Zhang1, Lei Yang1, Xiyan Li, Hong Bo, Jia Liu, Min Tan, Wenfei Zhu, Yuelong ShuComments to Author , and Dayan WangComments to Author 
Author affiliations: National Institute for Viral Disease Control and Prevention, Chinese Center for Disease Control and Prevention, Key Laboratory for Medical Virology, Beijing, China (J. Yang, Y. Zhang, L. Yang, X. Li, H. Bo, J. Liu, M. Tan, W. Zhu, D. Wang); School of Public Health (Shenzhen), Shenzhen campus of Sun Yat-sen University, Shenzhen, China (J. Yang, Y. Shu); Institute of Pathogen Biology of Chinese Academy of Medical Science/Peking Union Medical College, Beijing (Y. Shu)

Main Article

Figure 2

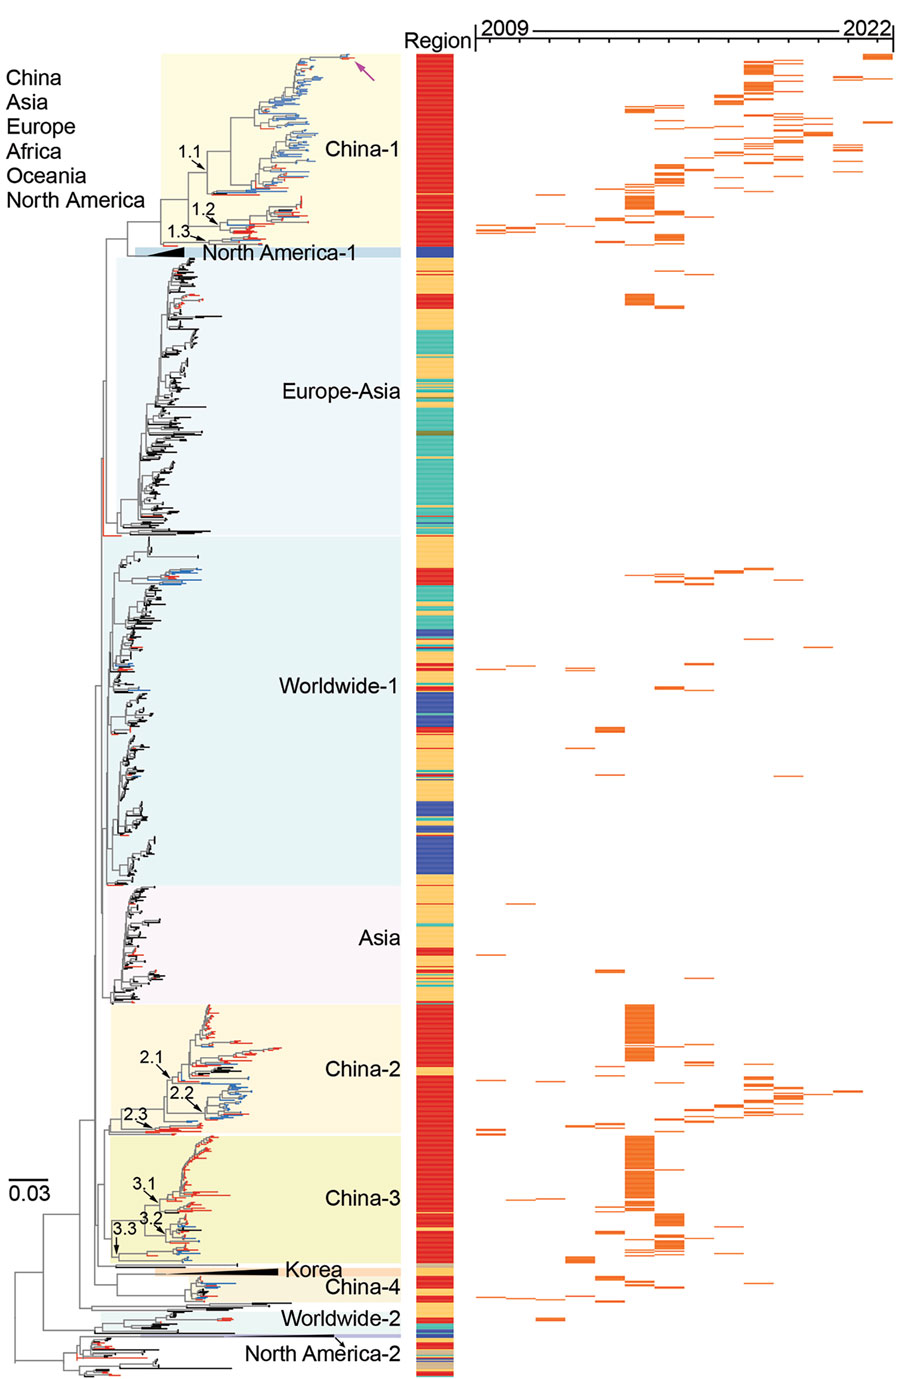
Maximum-likelihood phylogenetic tree of hemagglutinin genes of avian influenza viruses subtype H3 from China (n = 1,291) and reference sequences from GISAID (https://www.gisaid.org). Blue tree sections indicate sequences reported in this study; red tree sections indicate other H3 sequences from China; violet arrow at top of tree indicates human H3N8 virus. For clarity, some clades are collapsed. Sublineages are shown with different background colors on the phylogenetic tree. Subgroups in sublineages China-1, China-2, and China-3 are marked with black arrows at the nodes. The sampling locations are annotated with colored bars adjacent to the tree. For the H3 viruses sampled in China during 2009–2022, the sampling year of each of these viruses is shown on the right panel with orange horizontal bars. The phylogenetic tree of the H3 genes with more detailed information is shown in Appendix Figure 1. Scale bar indicates nucleotide substitutions per site.

Figure 2. Maximum-likelihood phylogenetic tree of hemagglutinin genes of avian influenza viruses subtype H3 from China (n = 1,291) and reference sequences from GISAID (https://www.gisaid.org). Blue tree sections indicate sequences reported in this study; red tree sections indicate other H3 sequences from China; violet arrow at top of tree indicates human H3N8 virus. For clarity, some clades are collapsed. Sublineages are shown with different background colors on the phylogenetic tree. Subgroups in sublineages China-1, China-2, and China-3 are marked with black arrows at the nodes. The sampling locations are annotated with colored bars adjacent to the tree. For the H3 viruses sampled in China during 2009–2022, the sampling year of each of these viruses is shown on the right panel with orange horizontal bars. The phylogenetic tree of the H3 genes with more detailed information is shown in Appendix Figure 1. Scale bar indicates nucleotide substitutions per site.

Main Article

1These authors contributed equally to this article.

Page created: April 06, 2023
Page updated: May 17, 2023
Page reviewed: May 17, 2023
The conclusions, findings, and opinions expressed by authors contributing to this journal do not necessarily reflect the official position of the U.S. Department of Health and Human Services, the Public Health Service, the Centers for Disease Control and Prevention, or the authors' affiliated institutions. Use of trade names is for identification only and does not imply endorsement by any of the groups named above.
file_external