Volume 29, Number 6—June 2023
Research
Evolution of Avian Influenza Virus (H3) with Spillover into Humans, China
Figure 4
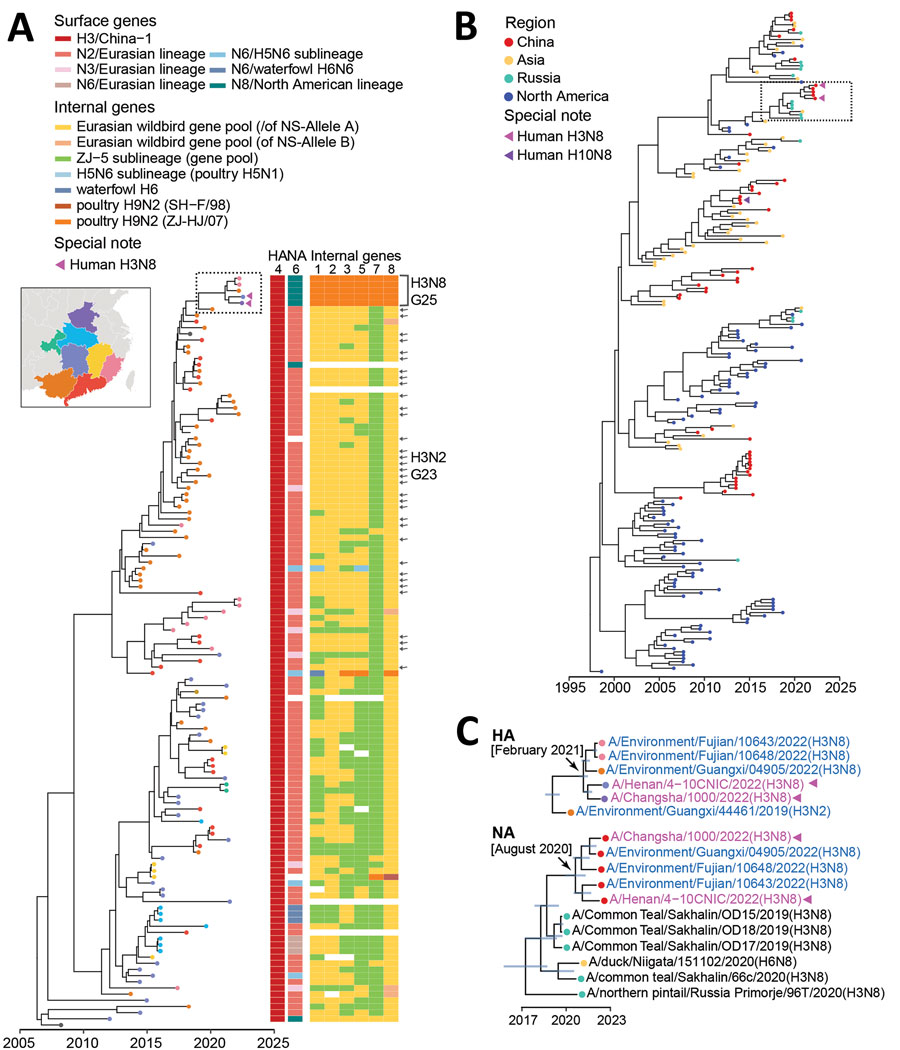
Figure 4. Bayesian time-resolved phylogenetic tree of hemagglutinin (HA) genes from avian influenza subtype H3 viruses and neuraminidase (NA) genes from subtype N8 viruses from China and reference sequences from GISAID (https://www.gisaid.org). A) Maximum clade credibility tree of HA genes of the China-1.1 H3 subgroup (n = 122). Tip points are colored by provinces (corresponding to the fill color in the map). Violet triangles indicate human H3N8 viruses. The lineage origins of each gene segment of H3 AIVs are represented by different colored tiles adjacent to the tree; the tile is blank if the sequence is unavailable. H3N2 G23 viruses are indicated with arrows. H3N8 G25 viruses are indicated within the bracket. The fully resolved tree with detailed information is depicted in Appendix Figure 6. B) Maximum clade credibility tree of N8 genes (n = 202). Tip points are colored by region. Violet triangles indicate human H3N8 viruses; purple triangle indicates human H10N8 virus. Virus names of the representative cluster (in the dashed box) are shown in panel C. The fully resolved tree with detailed information is depicted in Appendix Figure 7. C) Clades in the dashed box in panels A and B. Trees are drawn to the same scale. Blue indicates H3 avian influenza viruses sequenced in this study; violet indicates human H3N8 viruses. For HA (top) and NA (bottom) genes, branch tips are colored as in panels A and B. Blue node bars correspond to the 95% credible intervals of node heights. Arrows indicate the most recent common ancestors of HA and NA genes of H3N8 G25 viruses.
1These authors contributed equally to this article.