Volume 29, Number 7—July 2023
Research
Effect of Norovirus Inoculum Dose on Virus Kinetics, Shedding, and Symptoms
Figure 2

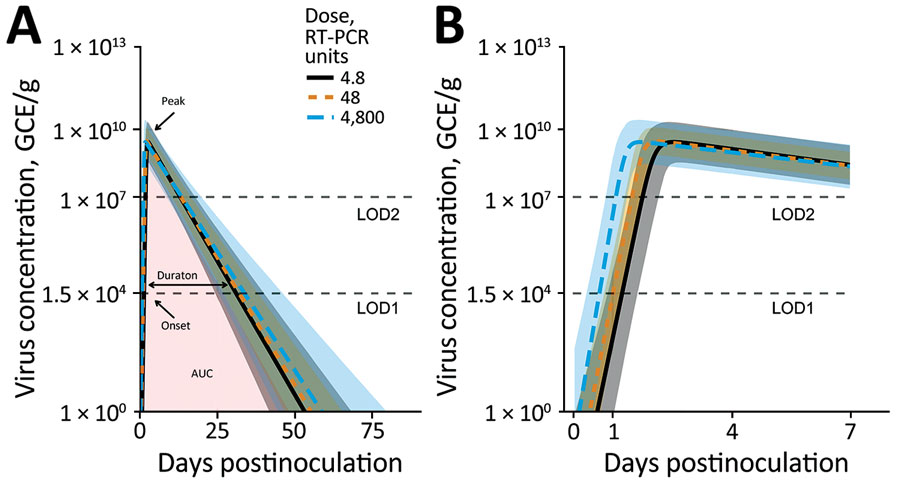
Figure 2. Fitted virus concentration (GEC/g) in feces of patients challenged with norovirus in study of the effect of norovirus inoculum dose on virus kinetics, shedding, and symptoms. A) Fitted curves showing the full infection time-course. Onset is time at which virus load rose to the LOD1 level. Duration is amount of time where virus load was above the LOD1 level. Peak is time to virus peak shedding. B) Zoomed in plot of the first 7 days to better show the initial increase and peak. Curves and shaded regions indicate means and credible intervals of the fitted time series Bayesian model. LOD1 and LOD2 lines indicate the 2 different limits of detection. Missing values attributable to limits of detection were treated as censors (Appendix). AUC, area under virus concentration curve; GEC, genomic equivalent copies; LOD, limit of detection; RT-PCR, reverse transcription PCR.