Skip directly to site content Skip directly to page options Skip directly to A-Z link Skip directly to A-Z link Skip directly to A-Z link
Volume 29, Number 7—July 2023
Research

Triplex ELISA for Assessing Durability of Taenia solium Seropositivity after Neurocysticercosis Cure

Nina L. Tang, Theodore E. Nash, Madelynn Corda, Thomas B. Nutman, and Elise M. O’ConnellComments to Author 
Author affiliation: National Institutes of Health, Bethesda, Maryland, USA

Main Article

Figure 7

Taenia solium seropositivity over time by a triplex assay to determine durability of T. solium seropositivity after neurocysticercosis cure. The triplex assay combines 3 families of T. solium antigens: T24H, GP50, and Ts18var3. A) Seropositivity at time of cure. B–D) Seropositivity at year 4 by neurocysticercosis disease type: B) parenchymal (n = 9); C) subarachnoid (n = 28); and D) ventricular disease (n = 9). Line colors in panels B–D correspond to bar colors in panel A. Horizonal dotted lines indicate the 100% specificity cutoff used for that protein. Statistically significant differences in seropositivity were seen between patients with parenchymal disease (67%) and subarachnoid disease (100%) (p = 0.011), but not for ventricular disease (89%), at the time of cure. Patients seropositive at time of cure (parenchymal n = 6, subarachnoid n = 28, ventricular n = 8) underwent testing of paired samples at time of cure (day 0) and 4 years after cure. For each subgroup, reactivity to GP50, T24H, and Ts18var3 showed statistically significant decreases by year 4. P, parenchymal; S, subarachnoid; V, ventricular.

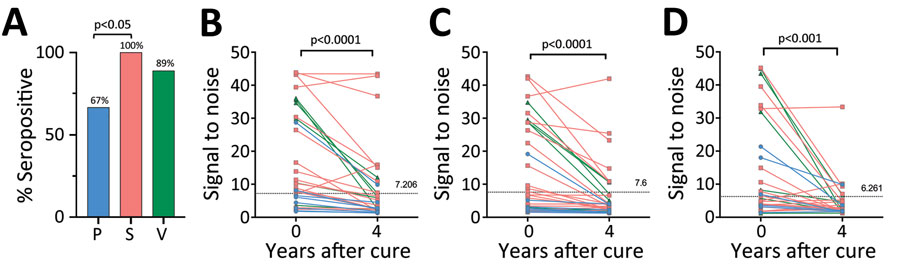
Figure 7. Taenia solium seropositivity over time by a triplex assay to determine durability of T. solium seropositivity after neurocysticercosis cure. The triplex assay combines 3 families of T. solium antigens: T24H, GP50, and Ts18var3. A) Seropositivity at time of cure. B–D) Seropositivity at year 4 by neurocysticercosis disease type: B) parenchymal (n = 9); C) subarachnoid (n = 28); and D) ventricular disease (n = 9). Line colors in panels B–D correspond to bar colors in panel A. Horizonal dotted lines indicate the 100% specificity cutoff used for that protein. Statistically significant differences in seropositivity were seen between patients with parenchymal disease (67%) and subarachnoid disease (100%) (p = 0.011), but not for ventricular disease (89%), at the time of cure. Patients seropositive at time of cure (parenchymal n = 6, subarachnoid n = 28, ventricular n = 8) underwent testing of paired samples at time of cure (day 0) and 4 years after cure. For each subgroup, reactivity to GP50, T24H, and Ts18var3 showed statistically significant decreases by year 4. P, parenchymal; S, subarachnoid; V, ventricular.

Main Article

Page created: May 08, 2023
Page updated: June 20, 2023
Page reviewed: June 20, 2023
The conclusions, findings, and opinions expressed by authors contributing to this journal do not necessarily reflect the official position of the U.S. Department of Health and Human Services, the Public Health Service, the Centers for Disease Control and Prevention, or the authors' affiliated institutions. Use of trade names is for identification only and does not imply endorsement by any of the groups named above.
file_external