Volume 29, Number 7—July 2023
Research
Triplex ELISA for Assessing Durability of Taenia solium Seropositivity after Neurocysticercosis Cure
Figure 8
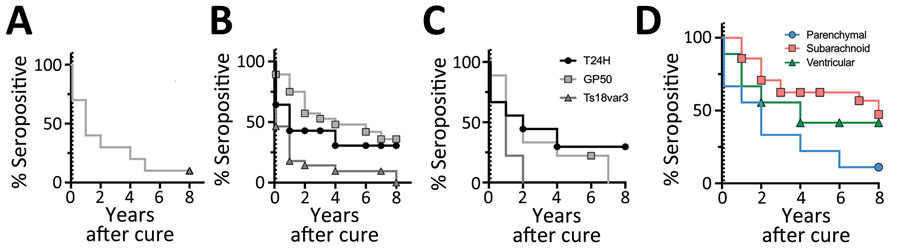
Figure 8. Degradation of Taenia solium seropositivity over time by a triplex assay to determine durability of T. solium seropositivity after neurocysticercosis cure. The assay combines 3 families of T. solium antigens: T24H, GP50, and Ts18var3. Kaplan-Meier survival curves show seropositivity by disease type for each protein over 8 years after neurocysticercosis cure. A) Parenchymal disease; B) subarachnoid disease; C) ventricular disease; D) all disease types. Time 0 represents time during treatment when all subjects were seropositive; dotted vertical line indicates time of cure. Symbols indicate years containing censored data for each disease type. The sample size for patients with parenchymal disease testing positive to T24H, GP50, or both, at cure were too few to plot. Therefore, these curves were excluded in this analysis. Log-rank Mantel-Cox analysis found significant differences in seroreversion in Ts18var3 compared with T24H and GP50 for both subarachnoid (p = 0.03) and ventricular disease (p = 0.04). Log-rank Mantel-Cox analysis for all survivors (D) demonstrates significant differences between the curves (p = 0.025); 11.1% of patients with parenchymal disease, 47.3% with subarachnoid disease, and 41.7% with ventricular disease were seropositive 8 years after cure.