Volume 30, Number 10—October 2024
Research
Early Introductions of Candida auris Detected by Wastewater Surveillance, Utah, USA, 2022–2023
Figure 1
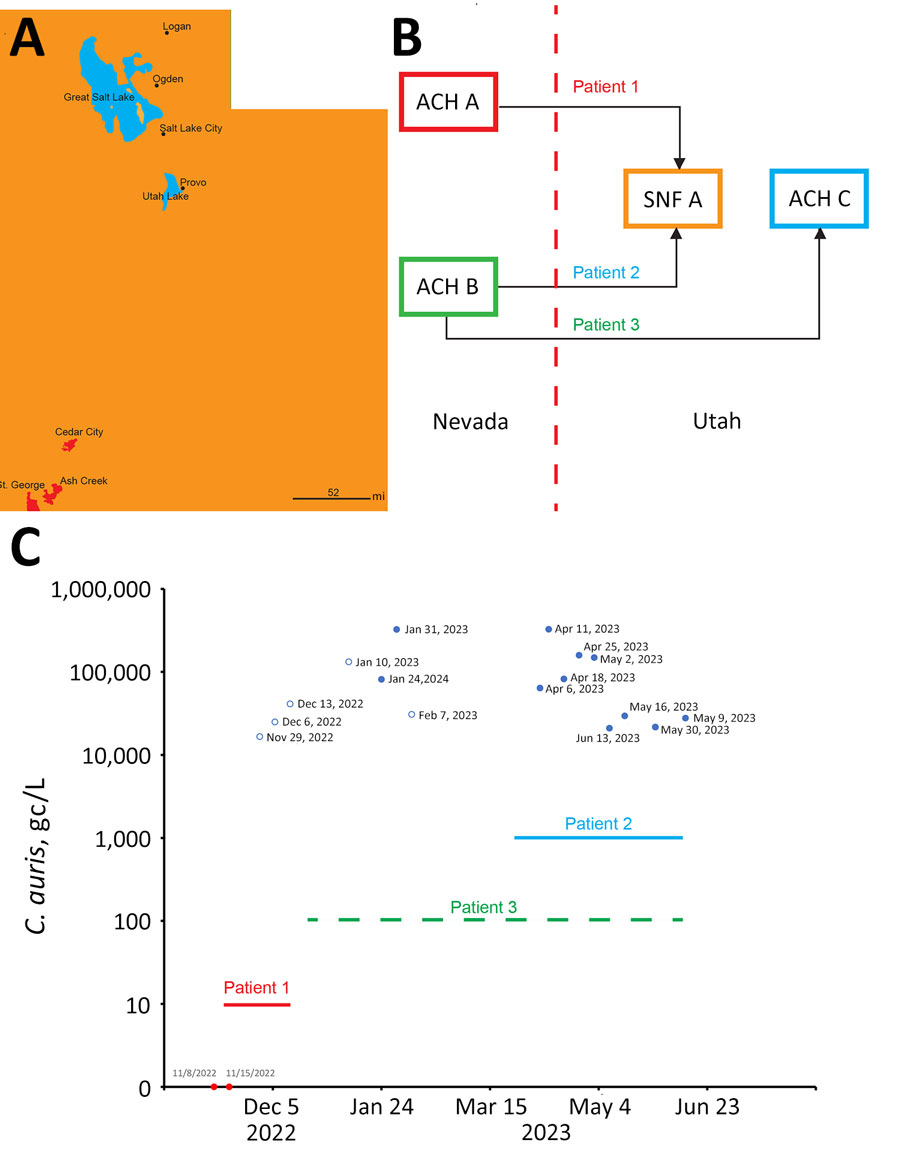
Figure 1. Transfer of Candida auris cases from Nevada to St. George, Utah, USA, and quantitative PCR monitoring of C. auris concentrations at the St. George wastewater treatment plant. A) Locations of the sewersheds of St. George, Ash Creek, and Cedar City (red) in Utah. The western border of Utah is adjacent to Nevada. Scale bar indicates 52 miles. B) Interstate transfers from Nevada to Utah of 3 patients with C. auris infection (red dash line represents the state border). C) Sampling dates and corresponding C. auris concentrations in wastewater treatment plant influent samples expressed as gc/L, over the time of the study. Nondetected samples are indicated as solid red dots, positive samples with concentrations less than the limit of quantification are indicated as empty blue dots, and positive samples with concentration at or equal to the limit of quantification are indicated as solid blue dots. The patient time frames are indicated by horizontal lines. The line for patient 3 is dashed to indicated that the person commuted continuously between Nevada and Utah. ACH, acute-care hospital; gc, gene copies; SNF, skilled nursing facility.
1These first authors contributed equally to this article.
2Current affiliation: Center for Disease Control and Prevention, Atlanta, Georgia, USA.
3Current affiliation: North Carolina Department of Health and Human Services, Wilmington, North Carolina, USA.