Volume 30, Number 10—October 2024
Research
Early Introductions of Candida auris Detected by Wastewater Surveillance, Utah, USA, 2022–2023
Figure 2
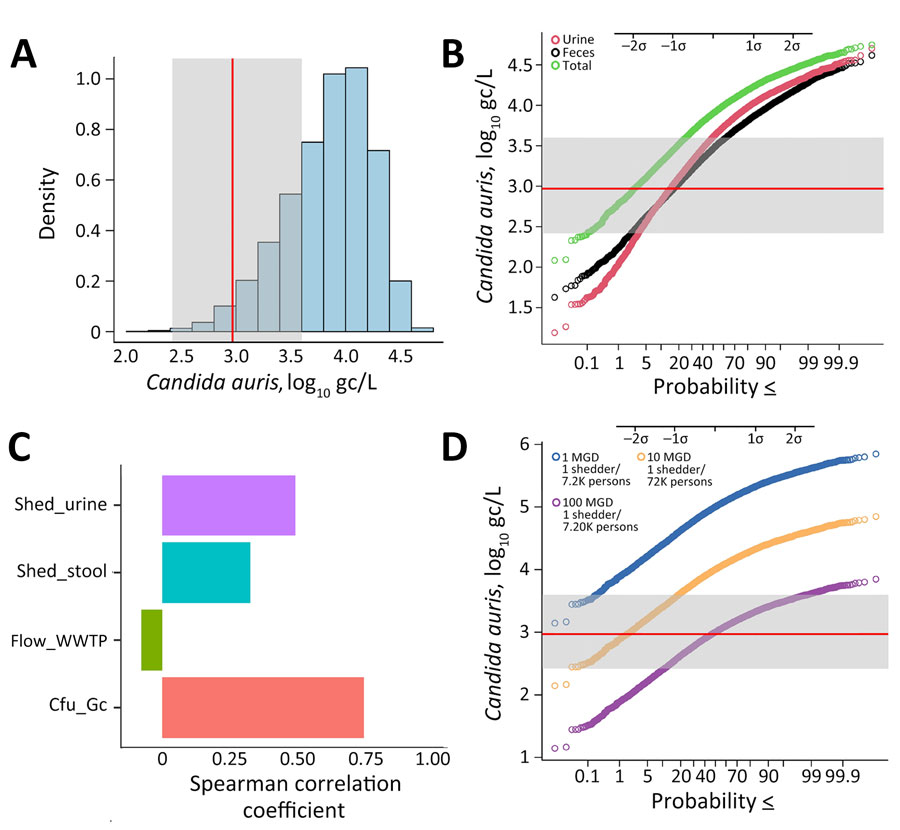
Figure 2. Monte Carlo simulation model forecasting Candida auris concentrations as a function of variable shedding levels in urine and feces, organism gene copy numbers, and WWTP flow rate (Table 2) as part of a study of Candida auris detection by wastewater surveillance, Utah, USA. A) Density plot of computed C. auris concentrations in wastewater resulting from 1 person shedding the organism in urine and feces. B) Probability plot showing the probability of detection at different organism concentrations. C) Sensitivity analysis, showing the correlation between individual parameters and their effect on predicted C. auris concentrations (i.e., the strength of the effect of each parameter on the model). D) Probability plot showing the effect of the magnitude of hypothetical flow rate (or sewershed size) on the likelihood of detecting the organism by quantitative PCR; infection prevalence metrics assume a St. George wastewater generation rate of 138 gpcd. In panels A, B, and D, the average limit of detection of the quantitative PCR is shown as a red line, and the minimum and maximum limits of detection observed in the study resulting from variation in sample-specific ESV are delineated by the gray area. Probabilities are less than or equal to the values indicated. ESV, equivalent sample volume; gc, gene copies; gcpd, gallons per capita per day; mgd, million gallons per day. WWTP, wastewater treatment plant.
1These first authors contributed equally to this article.
2Current affiliation: Center for Disease Control and Prevention, Atlanta, Georgia, USA.
3Current affiliation: North Carolina Department of Health and Human Services, Wilmington, North Carolina, USA.