Volume 30, Number 7—July 2024
Dispatch
Avian Influenza A(H5N1) Virus among Dairy Cattle, Texas, USA
Judith U. Oguzie1, Lyudmyla V. Marushchak1, Ismaila Shittu, John A. Lednicky, Aaron L. Miller, Haiping Hao, Martha I. Nelson, and Gregory C. Gray
Figure 1
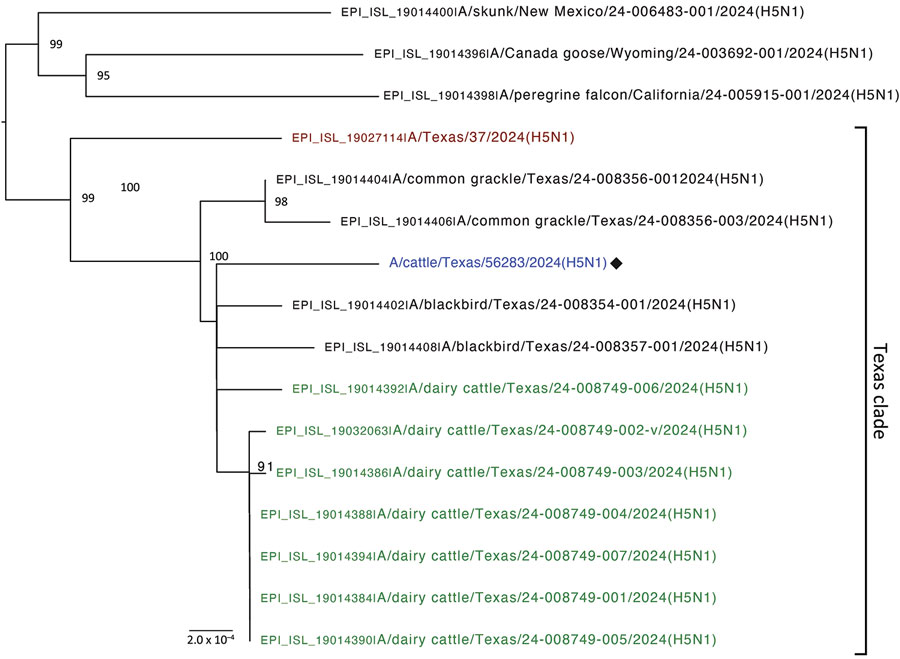
Figure 1. Phylogenetic tree of the concatenated genome in study of avian influenza A(H5N1) virus among dairy cattle, Texas, USA. Maximum-likelihood phylogenetic tree inferred for the A/cattle/Texas/5628356283/2024 (H5N1) virus isolated in this study (blue text) and 15 other closely related HPAI H5N1 viruses downloaded from GISAID (https://www.gisaid.org). Bootstrap values are provided for key nodes. The clade of 13 Texas viruses collected during March 2024 is labeled. Red text indicates human case (A/Texas/37/2024) and green text indicates cattle viruses collected from other farm(s) in Texas. Branch lengths are drawn to scale. Scale bar indicates number of substitutions per site.
1These first authors contributed equally to this article.
Page created: June 01, 2024
Page updated: June 22, 2024
Page reviewed: June 22, 2024
The conclusions, findings, and opinions expressed by authors contributing to this journal do not necessarily reflect the official position of the U.S. Department of Health and Human Services, the Public Health Service, the Centers for Disease Control and Prevention, or the authors' affiliated institutions. Use of trade names is for identification only and does not imply endorsement by any of the groups named above.