Volume 30, Number 9—September 2024
Research
Ecologic, Geoclimatic, and Genomic Factors Modulating Plague Epidemics in Primary Natural Focus, Brazil
Matheus F. Bezerra , Diego L.R.S. Fernandes, Igor V. Rocha, João L.L.P. Pitta, Natan D.A. Freitas, André L.S. Oliveira, Ricardo J.P.S. Guimarães, Elainne C.S. Gomes, Cecília Siliansky de Andreazzi, Marise Sobreira, Antonio M. Rezende, Pedro Cordeiro-Estrela, and Alzira M.P. Almeida
Figure 8
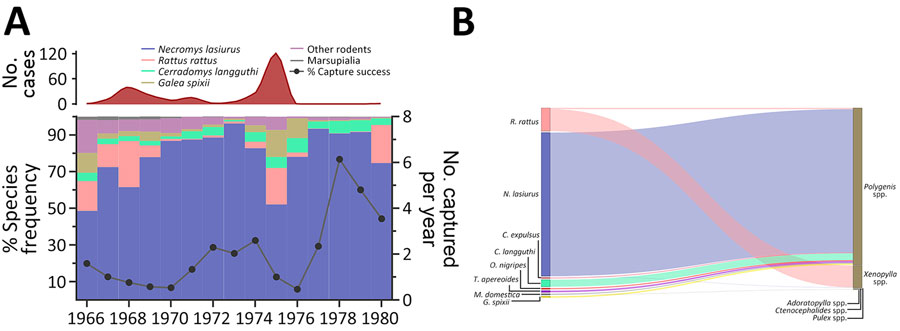
Figure 8. Diversity of rodent and flea species during distinct epidemiologic scenarios of plague in a study of ecologic, geoclimatic, and genomic factors modulating plague epidemics in primary natural focus, Brazil. A) Frequency of each rodent species on capture traps per year (left axis), yearly capture success (right axis) and human plague cases (red curve on top). B) Sankey diagram representing the distribution of rodents and other small mammal hosts according to the flea species and frequency.
Page created: July 11, 2024
Page updated: August 22, 2024
Page reviewed: August 22, 2024
The conclusions, findings, and opinions expressed by authors contributing to this journal do not necessarily reflect the official position of the U.S. Department of Health and Human Services, the Public Health Service, the Centers for Disease Control and Prevention, or the authors' affiliated institutions. Use of trade names is for identification only and does not imply endorsement by any of the groups named above.