Skip directly to site content Skip directly to page options Skip directly to A-Z link Skip directly to A-Z link Skip directly to A-Z link

Disclaimer: Early release articles are not considered as final versions. Any changes will be reflected in the online version in the month the article is officially released.

Volume 31, Number 1—January 2025
Research

Surveillance Strategy in Duck Flocks Vaccinated against Highly Pathogenic Avian Influenza Virus

Sophie Planchand, Timothée VergneComments to Author , Jean-Luc Guérin, Séverine Rautureau, Guillaume Gerbier, and Sébastien Lambert
Author affiliation: National Veterinary School of Toulouse, Toulouse, France (S. Planchand, T. Vergne, J.-L. Guérin, S. Lambert); French Ministry of Agriculture, Food Sovereignty and Forestry, Paris, France (S. Rautureau, G. Gerbier)

Main Article

Figure 1

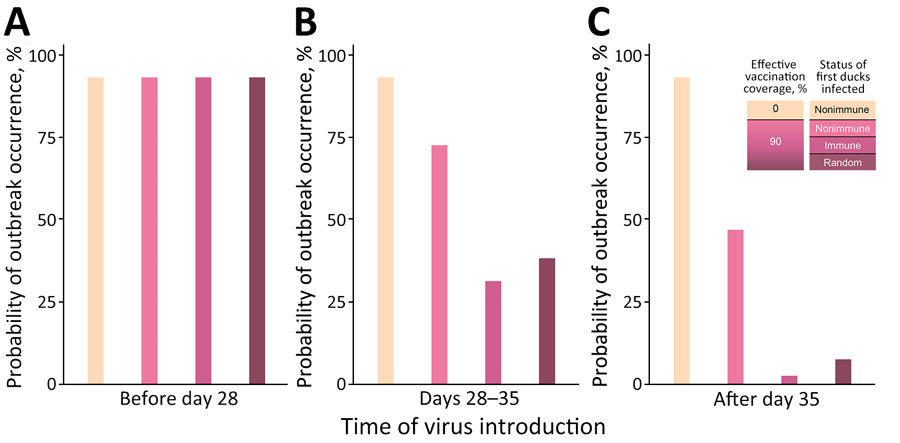
Probability of outbreak occurrence in nonvaccinated and preventively vaccinated duck flocks in a study of surveillance strategies in duck flocks vaccinated against highly pathogenic avian influenza virus. Graphs show different timings of virus introduction: A) preimmunity phase, in which the virus was introduced into the flock when ducks were not yet immune (i.e., before day 28); B) transition phase, in which the virus was introduced between day 28 and day 35; and C) immunity phase, in which the virus was introduced once immunity was fully reached. Each probability was calculated based on 500 stochastic simulations of the model. Effective vaccination coverage in vaccinated flocks was assumed to be 90%. Outbreak was defined as a simulation where >5 ducks became infected after the first infected duck. When we randomly selected the status of the first infected duck, we assumed a probability of 0.1 to be nonimmune and 0.9 to be immune.

Figure 1. Probability of outbreak occurrence in nonvaccinated and preventively vaccinated duck flocks in a study of surveillance strategies in duck flocks vaccinated against highly pathogenic avian influenza virus. Graphs show different timings of virus introduction: A) preimmunity phase, in which the virus was introduced into the flock when ducks were not yet immune (i.e., before day 28); B) transition phase, in which the virus was introduced between day 28 and day 35; and C) immunity phase, in which the virus was introduced once immunity was fully reached. Each probability was calculated based on 500 stochastic simulations of the model. Effective vaccination coverage in vaccinated flocks was assumed to be 90%. Outbreak was defined as a simulation where >5 ducks became infected after the first infected duck. When we randomly selected the status of the first infected duck, we assumed a probability of 0.1 to be nonimmune and 0.9 to be immune.

Main Article

Page created: December 02, 2024
Page updated: December 22, 2024
Page reviewed: December 22, 2024
The conclusions, findings, and opinions expressed by authors contributing to this journal do not necessarily reflect the official position of the U.S. Department of Health and Human Services, the Public Health Service, the Centers for Disease Control and Prevention, or the authors' affiliated institutions. Use of trade names is for identification only and does not imply endorsement by any of the groups named above.
file_external