Volume 31, Number 1—January 2025
Research
Surveillance Strategy in Duck Flocks Vaccinated against Highly Pathogenic Avian Influenza Virus
Figure 2
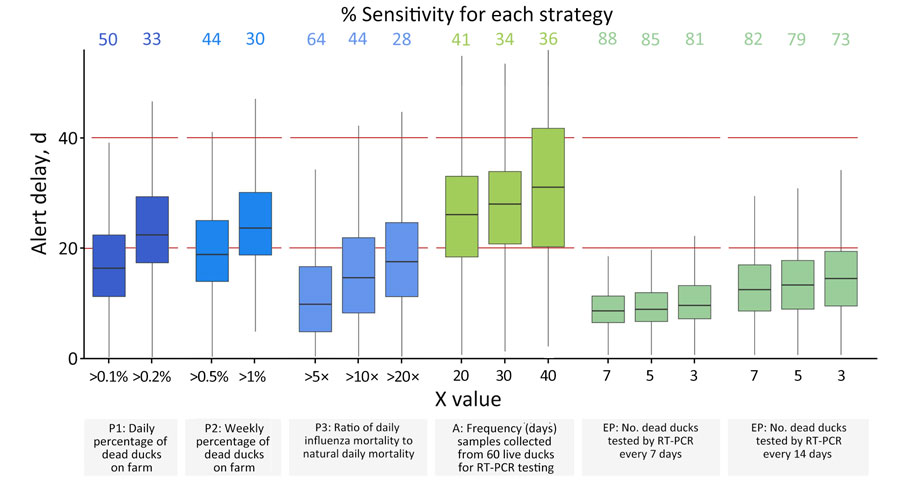
Figure 2. Comparison of the sensitivity and alert delay of different surveillance strategies in duck flocks vaccinated against highly pathogenic avian influenza virus. Effective vaccination coverage in vaccinated flocks was assumed to be 90%. For each of the surveillance strategies, 2 or 3 scenarios were tested by varying the value of X (Table 1). For passive surveillance strategies P1, P2, and P3, X referred to mortality thresholds (Table 1). For active surveillance, X referred to the frequency with which samples were taken from 60 live ducks on the farm. For enhanced passive surveillance, X referred to the number of dead ducks sampled each time. For each of these scenarios, the sensitivity and alert delay were compared. Sensitivity was the percentage of outbreaks out of 5,000 that triggered an alert. Alert delay was the distribution of the number of days between the virus introduction and the alert, out of 5,000 outbreaks. Red horizontal lines indicate upper and lower limits for alert delay. Horizontal lines within boxes indicate medians, box top and bottom edges indicate 50% prediction intervals, and whiskers indicate ranges. Percent sensitivity is shown above plots. A, active surveillance; EP, enhanced passive surveillance; P, passive surveillance; RT-PCR, reverse transcription PCR.