Volume 31, Supplement—May 2025
SUPPLEMENT ISSUE
Supplement
SARS-CoV-2 Genomic Surveillance from Community-Distributed Rapid Antigen Tests, Wisconsin, USA
Figure 3
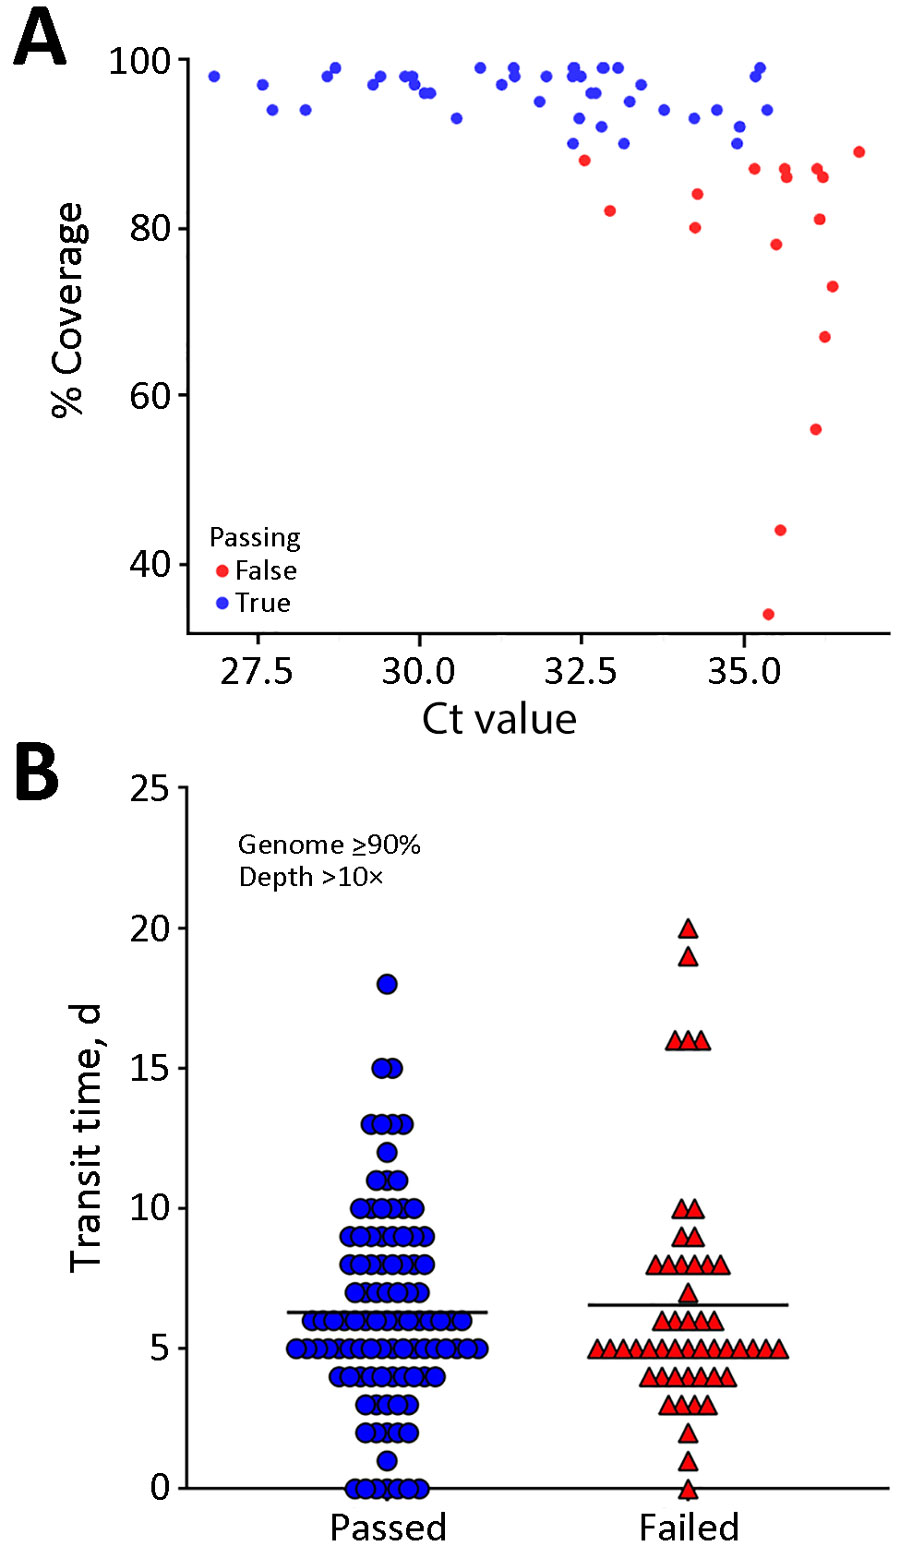
Figure 3. Comparison of passing and failing samples in a study of SARS-CoV-2 genomic surveillance from community-distributed rapid antigen tests, Wisconsin, USA. Scatterplots compare percentage coverage for Ct values (A) and transit times (B) for passing and failing RATs. Ct values were obtained through quantitative reverse transcription PCR. Sequences that passed the quality threshold had >90% coverage of the SARS-CoV-2 genome at >10× depth. The mean Ct for samples that passed was 31.7 and the mean Ct for those that failed was 35.3 (p<0.0001 by unpaired 2-tailed t-test; degrees of freedom = 59). Samples with lower Ct values correlated with higher SARS-CoV-2 coverage. Transit time refers to the number of days between a participant scanning the QR code provided with the RAT and receipt of positive RAT at our laboratory. The horizontal black line (B) is the mean value for each group. The mean transit time for passing samples was 6.3 (SD 3.6) days and the mean transit time for failing samples was 6.6 (SD 4.2) days. We noted no significant difference in transit times between passing and failing sequences (p = 0.69 by unpaired t-test). The amount of viral material present on RAT correlated with our ability to sequence samples, but time en route did not. Ct, cycle threshold; RAT, rapid antigen test.