Volume 31, Supplement—May 2025
SUPPLEMENT ISSUE
Supplement
Lessons from 5 Years of Routine Whole-Genome Sequencing for Epidemiologic Surveillance of Shiga Toxin–Producing Escherichia coli, France, 2018–2022
Figure 2
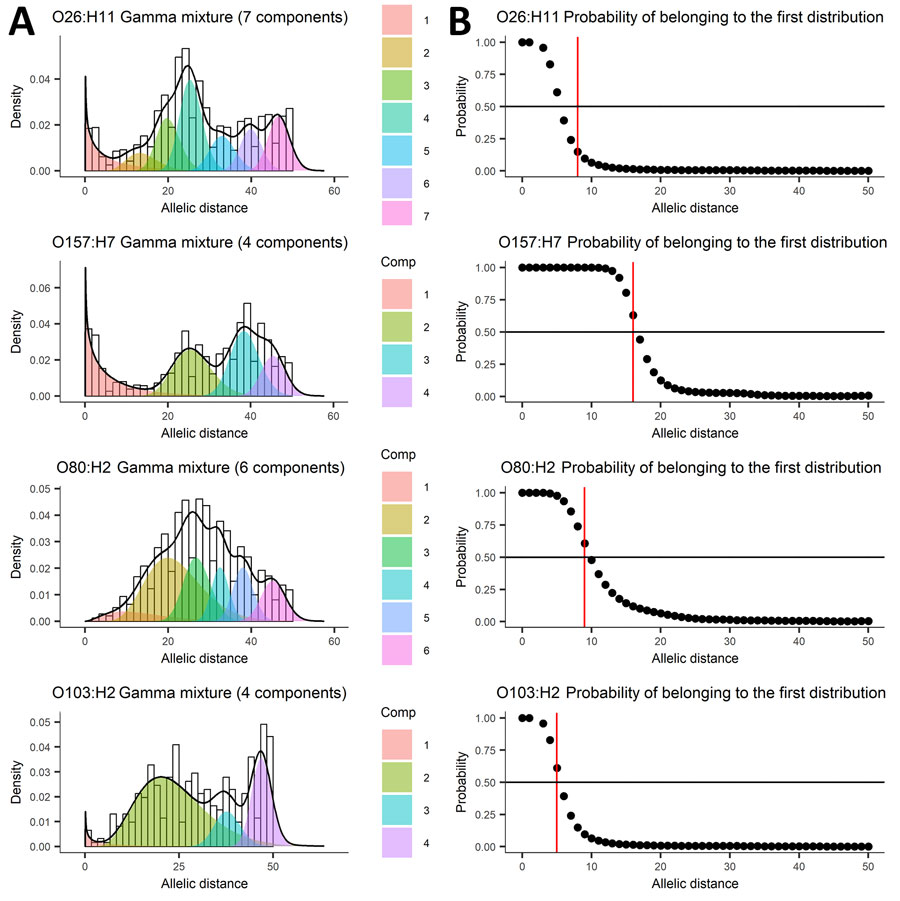
Figure 2. Mixture of distributions model applied to allelic distance data from 5 years of routine whole-genome sequencing for epidemiologic surveillance of Shiga toxin–producing Escherichia coli, France, 2018–2022. A) Number of components fit to the data distribution; B) threshold represented as the probability of belonging to the first distribution. Shiga toxin–producing Escherichia coli serotypes are shown for each panel. Black line indicates global estimated density; black circles, probability of belonging to first distribution for each observed allelic or single-nucleotide polymorphism distance; red line, largest allelic or single-nucleotide polymorphism distance that has a 50% probability of belonging to the first distribution. Comp, component.