Volume 31, Supplement—May 2025
SUPPLEMENT ISSUE
Supplement
Lessons from 5 Years of Routine Whole-Genome Sequencing for Epidemiologic Surveillance of Shiga Toxin–Producing Escherichia coli, France, 2018–2022
Gabrielle Jones , Carolina Silva Nodari, Laëtitia Fabre, Henriette de Valk, Harold Noel, Aurélie Cointe, Stéphane Bonacorsi, François-Xavier Weill, and Yann Le Strat
Figure 4
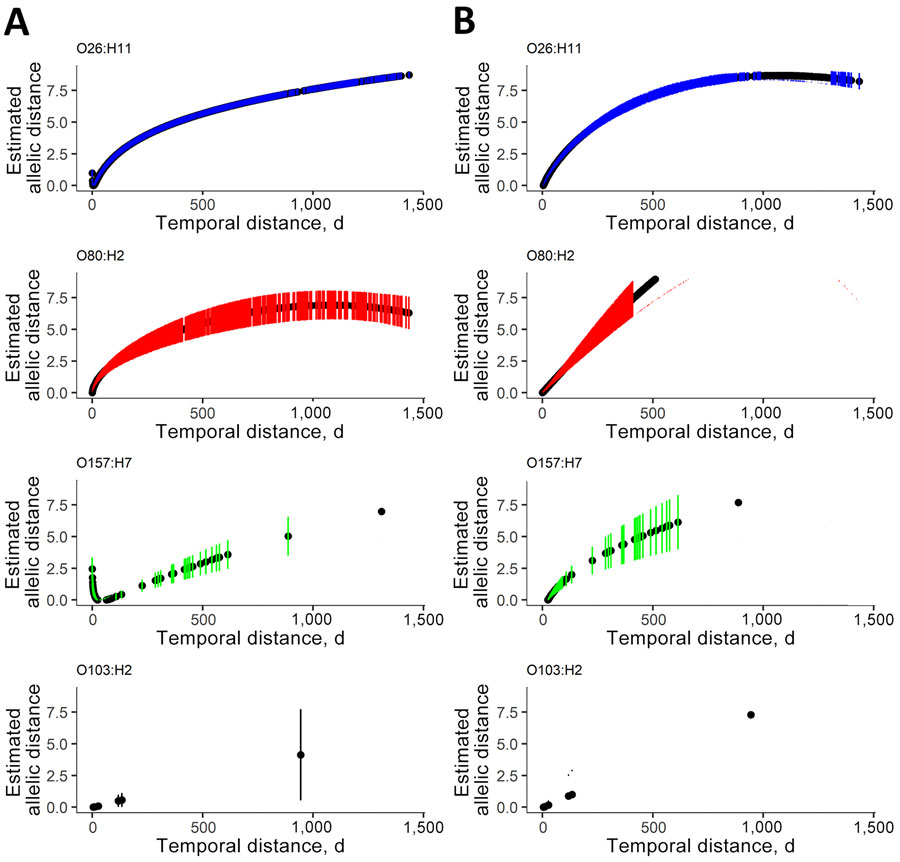
Figure 4. Regression from hierarchical clustering at a threshold of 5 allelic differences from 5 years of routine whole-genome sequencing for epidemiologic surveillance of Shiga toxin–producing Escherichia coli, France, 2018–2022. A) Allelic distance; B) SNP distance. Distances calculated as a function of time in days by multivariable fractional polynomial linear regression. Black circles indicate estimated allelic or SNP distance for each observed temporal distance in days; blue, red, green, and black vertical lines, 95% CIs of the estimated genomic distances for each observed temporal distance in days. SNP, single-nucleotide polymorphism.
Page created: April 08, 2025
Page updated: May 12, 2025
Page reviewed: May 12, 2025
The conclusions, findings, and opinions expressed by authors contributing to this journal do not necessarily reflect the official position of the U.S. Department of Health and Human Services, the Public Health Service, the Centers for Disease Control and Prevention, or the authors' affiliated institutions. Use of trade names is for identification only and does not imply endorsement by any of the groups named above.