Genomic Surveillance of Climate-Amplified Cholera Outbreak, Malawi, 2022–2023
Lucious Chabuka
1, Wonderful T. Choga
1, Carla N. Mavian
1
, Monika Moir
1, Christian Morgenstern
1, Houriiyah Tegally, Abhinav Sharma, Eduan Wilkinson, Yeshnee Naidoo, Rhys Inward, Samir Bhatt, G.R. William Wint, Kamran Khan, Isaac I. Bogoch, Moritz U.G. Kraemer, José Lourenço, Cheryl Baxter, Massimiliano Tagliamonte, Marco Salemi, Richard J. Lessells, Collins Mitambo, Ronald Chitatanga, Joseph Bitilinyu-Bango, Mabvuto Chiwaula, Yollamu Chavula, Mphatso Bukhu, Happy Manda, Moses Chitenje, Innocent Malolo, Alex Mwanyongo, Bernard Mvula, Mirrium Nyenje, Tulio de Oliveira
, and Mathew Kagoli
Author affiliation: Centre for Epidemic Control and Innovation, School of Data Science and Computational Thinking, Stellenbosch University, Stellenbosch, South Africa (L. Chabuka, W.T. Choga, M. Moir, H. Tegally, E. Wilkinson, Y. Naidoo, C. Baxter, T. de Oliveira); Public Health Institute of Malawi, Lilongwe, Malawi (L. Chabuka, C. Mitambo, R. Chitatanga, J. Bitilinyu- Bango, M. Chiwaula, Y. Chavula, M. Bukhu, H. Manda, M. Chitenje, I. Malolo, A. Mwanyongo, B. Mvula, M. Nyenje, M. Kagoli); University of Florida Emerging Pathogens Institute, Gainesville, Florida, USA (C.N. Mavian, M. Tagliamonte, M. Salemi); Imperial College London, London, UK (C. Morgenstern, S. Bhatt); South African Medical Research Council Centre for Tuberculosis Research, Cape Town, South Africa (A. Sharma); University of Oxford, Oxford, UK (R. Inward, G.R. William Wint, M.U.G. Kraemer); Copenhagen University, Copenhagen, Denmark (S. Bhatt); Environmental Research Group Oxford, Oxford (G.R. WilliamWint); BlueDot, Toronto, Ontario, Canada (K. Khan); University of Toronto, Toronto (K. Khan, I.I. Bogoch); Pandemic Sciences Institute, University of Oxford, Oxford (M.U.G. Kraemer); Biosystems and Integrative Sciences Institute at University of Lisbon, Lisbon, Portugal (J. Lourenço); Kwazulu-Natal Research and Innovation Sequencing Platform, Durban, South Africa (R.J. Lessells, T. de Oliveira)
Main Article
Figure 6
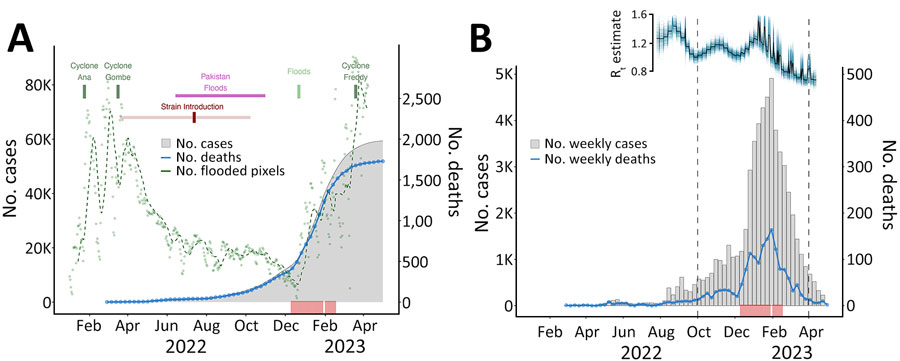
Figure 6. Relationships between confirmed cholera cases and cholera outbreak dynamics in Malawi during the 2022–2023 outbreak. A) Cyclones and flooding events affecting Malawi are shown. Green dots represent flooding conditions across Malawi as the daily number of pixels detected from remotely sensed satellite imagery; dashed green line indicates the moving average. Dark red mark indicates inferred time of introduction of a Pakistan strain into Malawi; the lighter shaded line indicates the 95% highest posterior density interval for the time estimate. B) Weekly number of newly confirmed cholera cases and deaths in Malawi during February 2022‒April 2023. Estimation of Rt and association with other variables is shown above the case data for September 2022‒April 2023 with plots of posterior distributions, median (black), and sample paths (blue). In both plots, red rug plot below charts indicates temporal distribution of cases sequenced in our study. Rt, time-varying reproduction number.
Main Article
Page created: May 01, 2025
Page updated: May 27, 2025
Page reviewed: May 27, 2025
The conclusions, findings, and opinions expressed by authors contributing to this journal do not necessarily reflect the official position of the U.S. Department of Health and Human Services, the Public Health Service, the Centers for Disease Control and Prevention, or the authors' affiliated institutions. Use of trade names is for identification only and does not imply endorsement by any of the groups named above.