Skip directly to site content Skip directly to page options Skip directly to A-Z link Skip directly to A-Z link Skip directly to A-Z link

Disclaimer: Early release articles are not considered as final versions. Any changes will be reflected in the online version in the month the article is officially released.

Volume 31, Number 8—August 2025

Research

Transmission Dynamics of Highly Pathogenic Avian Influenza A(H5N1) and A(H5N6) Viruses in Wild Birds, South Korea, 2023–2024

Ye-Ram Seo1, Andrew Y. Cho1, Dong-Ju Kim1, Young-Jae Si, Hye-sung Jeong, Su-woong Lee, Chang-Seon Song, and Dong-Hun LeeComments to Author 
Author affiliation: Konkuk University, Seoul, South Korea (Y.-R. Seo, A.Y. Cho, C.-S. Song, D.-H. Lee); National Institute of Wildlife Disease Control and Prevention, Gwangju, South Korea (D.-J. Kim, Y.-J. Si, H.-S. Jeong, S.-W Lee)

Main Article

Figure 3

Transmission dynamics of highly pathogenic avian influenza A(H5N1) virus in wild birds, South Korea, 2023–2024. A) Maximum clade credibility tree constructed using the hemagglutinin gene of H5N1 viruses. Each branch is colored according to the geographic location. Scale bar shows years of detection in decimal year format. B) Visualization of transmission dynamics inferred by using the geographic location trait in South Korea. Arrows represent the direction of the viral transmission; annotated values along arrows represent Bayes factors. Thick arrows indicate strongly supported routes (Bayes factor >20, posterior probability >0.8). Maps provided by d-maps.com (https://d-maps.com).

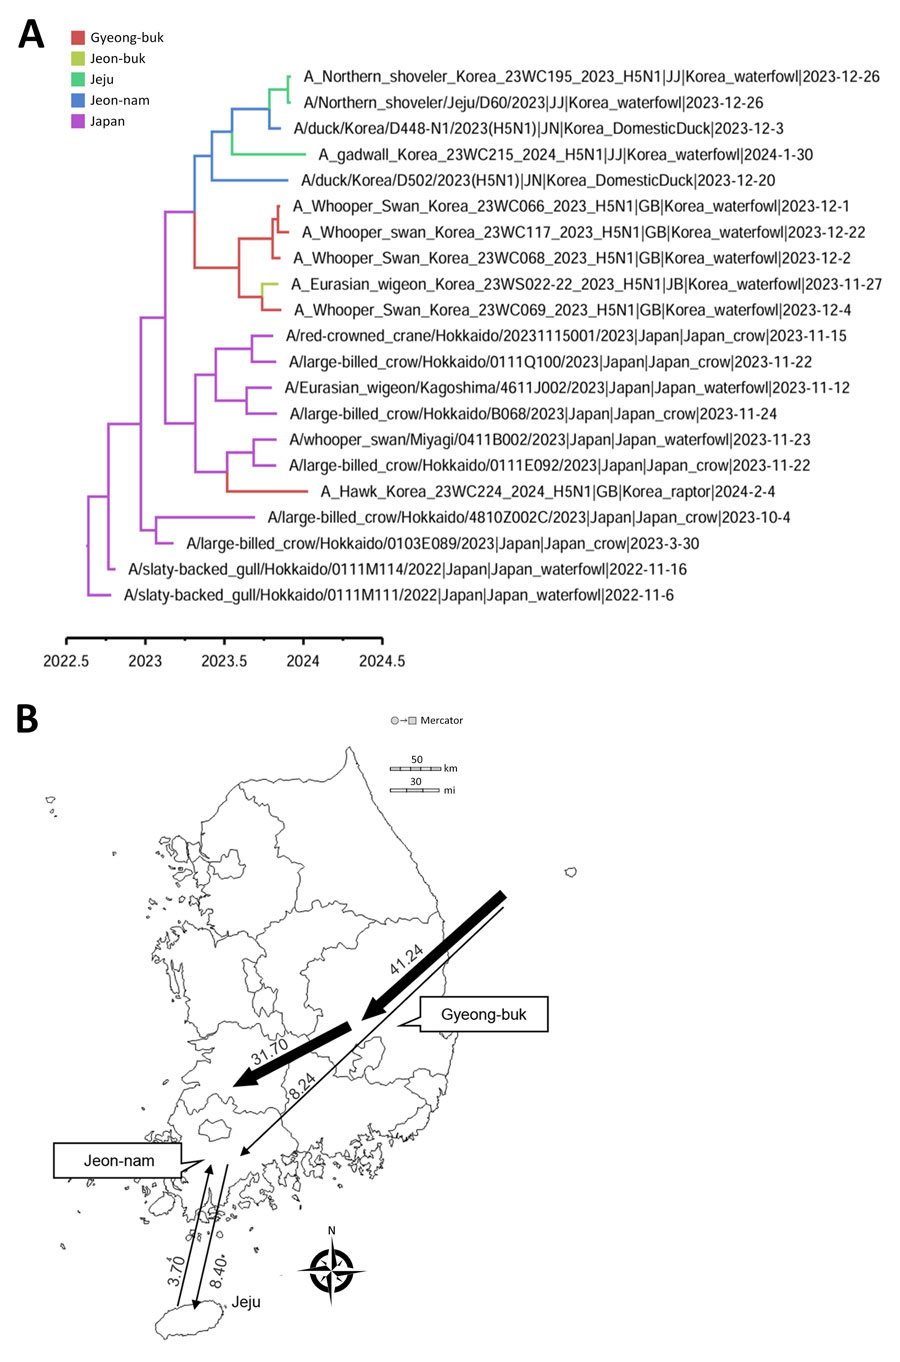
Figure 3. Transmission dynamics of highly pathogenic avian influenza A(H5N1) virus in wild birds, South Korea, 2023–2024. A) Maximum clade credibility tree constructed using the hemagglutinin gene of H5N1 viruses. Each branch is colored according to the geographic location. Scale bar shows years of detection in decimal year format. B) Visualization of transmission dynamics inferred by using the geographic location trait in South Korea. Arrows represent the direction of the viral transmission; annotated values along arrows represent Bayes factors. Thick arrows indicate strongly supported routes (Bayes factor >20, posterior probability >0.8). Maps provided by d-maps.com (https://d-maps.com).

Main Article

1These first authors contributed equally to this article.

Page created: June 23, 2025
Page updated: July 09, 2025
Page reviewed: July 09, 2025
The conclusions, findings, and opinions expressed by authors contributing to this journal do not necessarily reflect the official position of the U.S. Department of Health and Human Services, the Public Health Service, the Centers for Disease Control and Prevention, or the authors' affiliated institutions. Use of trade names is for identification only and does not imply endorsement by any of the groups named above.
file_external