Skip directly to site content Skip directly to page options Skip directly to A-Z link Skip directly to A-Z link Skip directly to A-Z link

Volume 31, Number 9—September 2025

Research

Theileria luwenshuni and Novel Babesia spp. Infections in Humans, Yunnan Province, China

Rong Xiang1, Chun-Hong Du1, Yi-Lin Zhao1, Zhi Luo, Miao Li, Dan-Ni Zeng, Fan Wang, Chao-Bo Du, Yi SunComments to Author , Qiao-Cheng ChangComments to Author , and Jia-Fu JiangComments to Author 
Author affiliation: Author affiliations: State Key Laboratory of Pathogen and Biosecurity, Academy of Military Medical Sciences, Beijing, China (R. Xiang, Y.-L. Zhao, D.-N. Zeng, Y. Sun, J.-F. Jiang); Yunnan Institute of Endemic Disease Control and Prevention, Dali, China (C.-H. Du, Z. Luo, M. Li, F. Wang, C.-B. Du ); School of Public Health at Shantou University, Shantou, China (Q.-C. Chang)

Main Article

Figure 4

Phylogenetic analysis of 18s rRNA (1,600-bp) gene sequences of Theileria and Babesia spp. isolates in study of piroplasmorida in humans, southwest China, May 2017–June 2020. Tree on the left highlights the sequences of novel variants/strains (accession nos. PQ722834–6, PQ722839–82). Tree on the right shows classification and distribution of all detected organisms across various hosts and vectors. Colored shading represents groups of isolates by strain. Dotted lines indicate the correspondence between different organisms, illustrating their ecologic and evolutionary connections. Left scale bar represents 0.01 substitutions per site; right scale bar represents 0.02 substitutions per site.

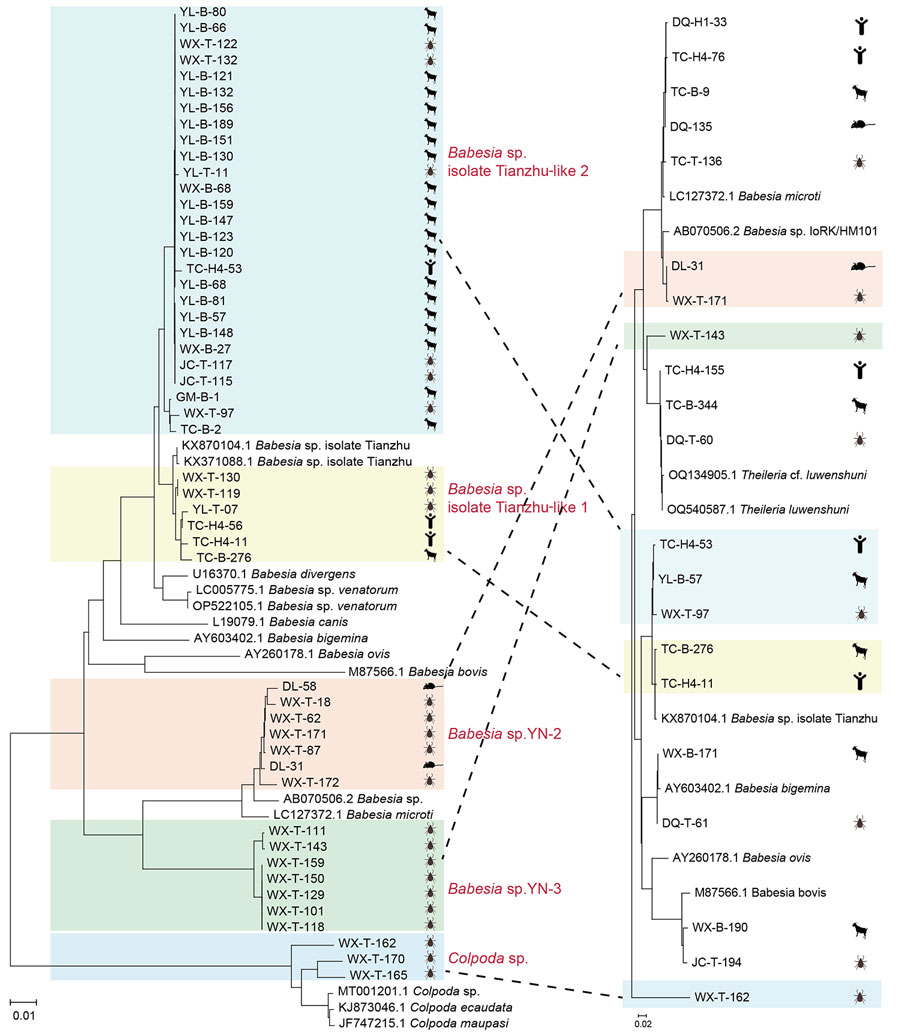
Figure 4. Phylogenetic analysis of 18s rRNA (1,600-bp) gene sequences of Theileria and Babesia spp. isolates in study of piroplasmorida in humans, southwest China, May 2017–June 2020. Tree on the left highlights the sequences of novel variants/strains (accession nos. PQ722834–6, PQ722839–82). Tree on the right shows classification and distribution of all detected organisms across various hosts and vectors. Colored shading represents groups of isolates by strain. Dotted lines indicate the correspondence between different organisms, illustrating their ecologic and evolutionary connections. Left scale bar represents 0.01 substitutions per site; right scale bar represents 0.02 substitutions per site.

Main Article

1These authors contributed equally to this article.

Page created: July 17, 2025
Page updated: August 26, 2025
Page reviewed: August 26, 2025
The conclusions, findings, and opinions expressed by authors contributing to this journal do not necessarily reflect the official position of the U.S. Department of Health and Human Services, the Public Health Service, the Centers for Disease Control and Prevention, or the authors' affiliated institutions. Use of trade names is for identification only and does not imply endorsement by any of the groups named above.
file_external