Volume 32, Number 10—October 2026
Dispatch
Whole-Genome Sequencing of Measles Virus from 2025 Outbreak, Texas, USA
Piyada Juntawong , Bonnie Oh, Richard Bovio, Jie Lu, Sydney Stanley, Robert F. Potter, Yan Sun, Casey Schroeder, Olivia A. Smith, Elise Huebner, Stephen L. White, Saroj Rai, Varun Shetty, and Grace Kubin
, Bonnie Oh, Richard Bovio, Jie Lu, Sydney Stanley, Robert F. Potter, Yan Sun, Casey Schroeder, Olivia A. Smith, Elise Huebner, Stephen L. White, Saroj Rai, Varun Shetty, and Grace Kubin
Figure 4
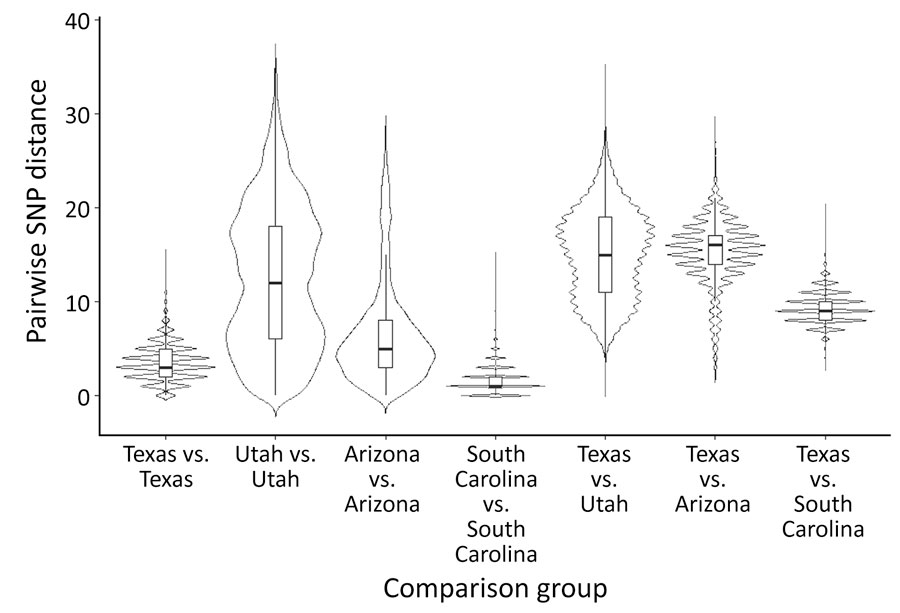
Figure 4. Pairwise SNP-distance distributions among genomes in the focal expanding North American genotype D8 lineage from study of whole-genome sequencing of measles virus from 2025 outbreak, Texas, USA. Violin plots show distributions of pairwise SNP distances within Texas, Utah, Arizona, and South Carolina and between Texas and each comparison jurisdiction. Embedded boxplots show medians (horizonal lines) and interquartile ranges (box tops and bottoms); whiskers indicate the most extreme values within 1.5x the interquartile range below the first quartile or above the third quartile. Wider sections of violins indicate greater density of pairwise comparisons. SNP, single-nucleotide polymorphism.
Page created: September 10, 2026
Page updated: September 28, 2026
Page reviewed: September 28, 2026
The conclusions, findings, and opinions expressed by authors contributing to this journal do not necessarily reflect the official position of the U.S. Department of Health and Human Services, the Public Health Service, the Centers for Disease Control and Prevention, or the authors' affiliated institutions. Use of trade names is for identification only and does not imply endorsement by any of the groups named above.