Volume 32, Supplement –Summer 2026
SUPPLEMENT ISSUE
Supplement
Temporal Alignment of Wastewater Signals with Clinical Indicators of Respiratory Illness Postpandemic, Texas, USA
 , Micaela Sandoval, Thuy Nguyen, Isrrael Perez, Lopita Ghosh, Trudy Krause, Cecilia Ganduglia Cazaban, Remy Pasco, Lauren Meyers, Fuqing Wu, Janelle Rios, Michael Tisza, Justin Clark, Anthony Maresso, Eric Boerwinkle, and Cici Bauer
Figure 2
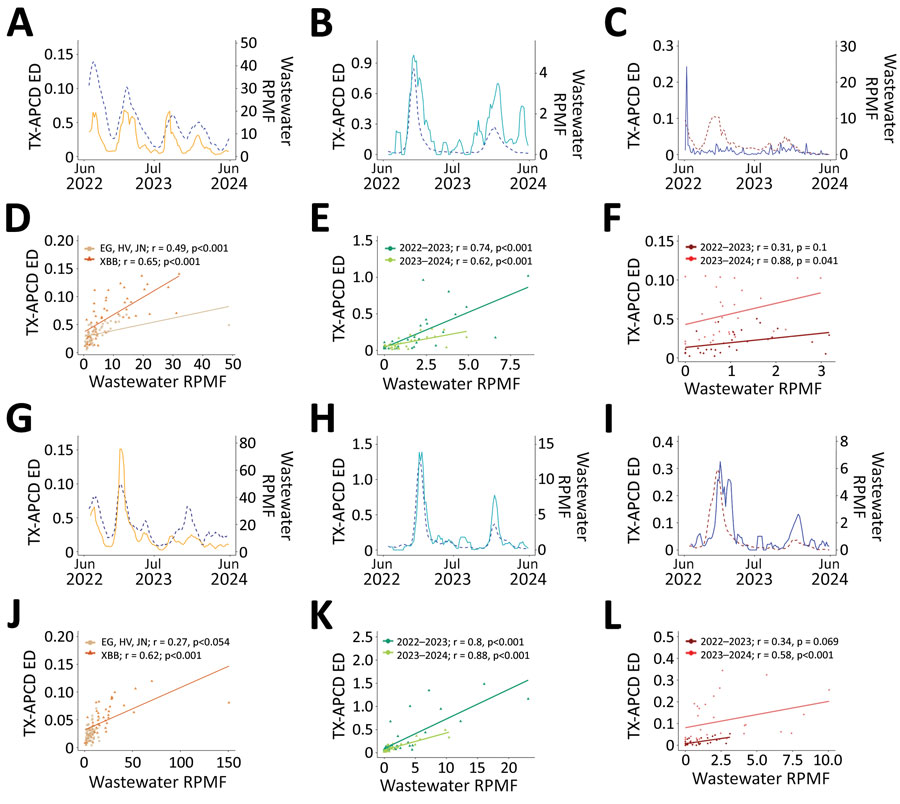
Figure 2. Association between weekly wastewater signals (RPMF) and weekly TX-APCD ED claims for SARS-CoV-2, influenza, and RSV in Harris and El Paso Counties, Texas, June 2022–June 2024. A–C) Harris County weekly trends in wastewater RPMF values versus TX-APCD ED visits for SARS-CoV-2 (A), influenza (B), and RSV (C). Solid lines represent TX-APCD claims; dashed lines represent RPMF data. D–F) Weekly RPMF values versus NSSP ED visits for SARS-CoV-2 (D), influenza (E), and RSV (F). Triangles and diamonds represent single-week observations. G–I) El Paso County interpolated daily time series of RPMF values versus TX-APCD ED visits for SARS-CoV-2 (G), influenza (H), and RSV (I). Solid lines represent TX-APCD claims; dashed lines represent RPMF data. J–L) Weekly RPMF values versus NSSP ED visits for (J) SARS-CoV-2, (K) influenza, and (L) RSV. Triangles and diamonds represent single-week observations. Corresponding Pearson correlation coefficients (r) and p values are shown. ED, emergency department; RPMF, reads per million filtered; TX-APCD, Texas All-Payer Claims Database.