Volume 32, Supplement –Summer 2026
SUPPLEMENT ISSUE
Supplement
Correlations between Wastewater Concentrations of Influenza A and Respiratory Syncytial Viruses and Clinical Laboratory Testing and Hospitalization Data, California, USA
 , Madhura S. Rane, Marisa A.P. Donnelly, Lauren A. White, Cora Hoover, Monica Sun, Caroline Collins, Andrew Abram, Mariah Otstot, Joel Rojas, Cody Berkobien, Seema Jain, Duc J. Vugia, Wayne T.A. Enanoria, Linlin Li, Chad Below, Marlene Wolfe, Alexandria B. Boehm, Tomás M. León, Erin L. Murray, and Alexander T. Yu
Figure 1
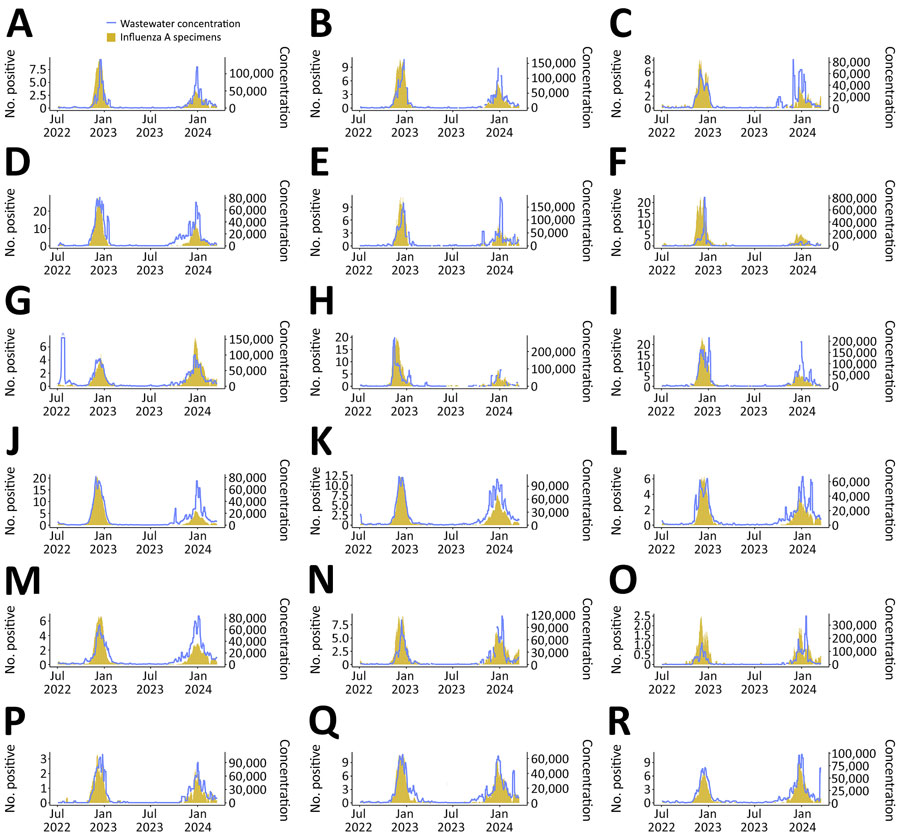
Figure 1. Time series comparison of wastewater and influenza A virus–positive specimens via electronic laboratory reporting from study of correlations between wastewater concentrations of influenza A and respiratory syncytial viruses and clinical laboratory testing and hospitalization data, California, USA, July 2022–March 2024. Reported influenza A virus–positive specimens were geocoded to sewersheds for comparisons. We calculated 7-day rolling average numbers of influenza A virus-positive specimens per 100,000 persons reported via electronic laboratory reporting (yellow bars) and influenza A viral wastewater concentrations in gene copies per gram (light blue line) for 18 sewersheds: A) Alameda (Alameda East Bay); B) Contra Costa (Central Contra Costa); C) Yolo (Davis); D) Santa Clara (Gilroy/Morgan Hill); E) San Mateo (Half Moon Bay); F) Marin (Novato); G) Santa Clara (Palo Alto); H) Sonoma (Petaluma); I) Contra Costa (Richmond); J) Sacramento (Sacramento); K) Santa Clara (San Jose); L) San Francisco (San Francisco Oceanside); M) San Francisco (San Francisco Southeast); N) San Mateo (San Mateo); O) Santa Cruz (Santa Cruz City); P) Santa Cruz (Santa Cruz County); Q) San Mateo (Silicon Valley); R) Santa Clara (Sunnyvale).