Volume 32, Supplement –Summer 2026
SUPPLEMENT ISSUE
Supplement
Correlations between Wastewater Concentrations of Influenza A and Respiratory Syncytial Viruses and Clinical Laboratory Testing and Hospitalization Data, California, USA
Elisabeth Burnor , Madhura S. Rane, Marisa A.P. Donnelly, Lauren A. White, Cora Hoover, Monica Sun, Caroline Collins, Andrew Abram, Mariah Otstot, Joel Rojas, Cody Berkobien, Seema Jain, Duc J. Vugia, Wayne T.A. Enanoria, Linlin Li, Chad Below, Marlene Wolfe, Alexandria B. Boehm, Tomás M. León, Erin L. Murray, and Alexander T. Yu
, Madhura S. Rane, Marisa A.P. Donnelly, Lauren A. White, Cora Hoover, Monica Sun, Caroline Collins, Andrew Abram, Mariah Otstot, Joel Rojas, Cody Berkobien, Seema Jain, Duc J. Vugia, Wayne T.A. Enanoria, Linlin Li, Chad Below, Marlene Wolfe, Alexandria B. Boehm, Tomás M. León, Erin L. Murray, and Alexander T. Yu
Figure 3
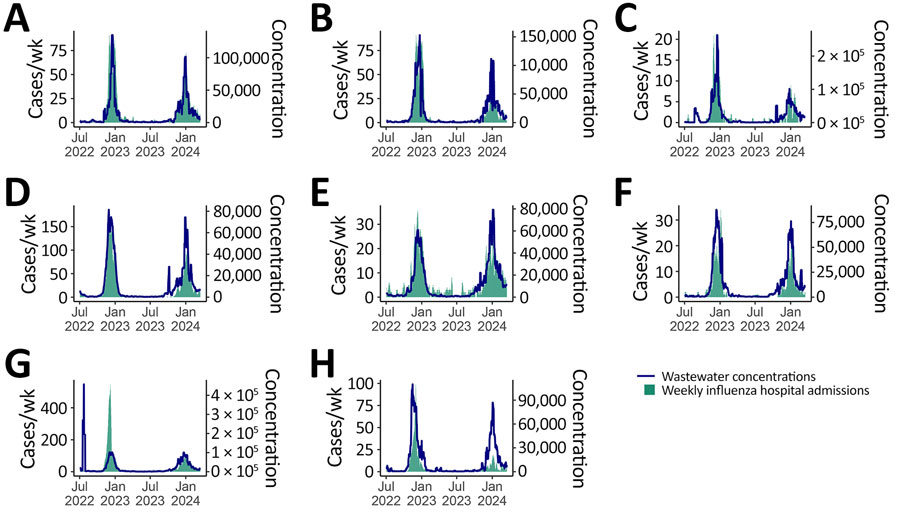
Figure 3. Time series comparison of influenza A virus wastewater concentrations and hospital admissions from study of correlations between wastewater concentrations of influenza A and respiratory syncytial viruses and clinical laboratory testing and hospitalization data, California, USA. Graphs show rolling 7-day county-level influenza hospital admissions (green bars) and county-aggregated population-weighted averages of nonnormalized influenza A wastewater concentrations in gene copies per gram from all sampling sewersheds within each county (dark blue line) for 8 counties: A) Alameda; B) Contra Costa; C) Marin; D) Sacramento; E) San Francisco; F) San Mateo; G) Santa Clara; H) Sonoma.
Page created: July 16, 2026
Page updated: September 15, 2026
Page reviewed: September 15, 2026
The conclusions, findings, and opinions expressed by authors contributing to this journal do not necessarily reflect the official position of the U.S. Department of Health and Human Services, the Public Health Service, the Centers for Disease Control and Prevention, or the authors' affiliated institutions. Use of trade names is for identification only and does not imply endorsement by any of the groups named above.