Volume 32, Number 2—February 2026
Research
Using Routine Surveillance Data to Assess Dengue Virus Transmission Risk in Travelers Returning to the United States
Figure 1
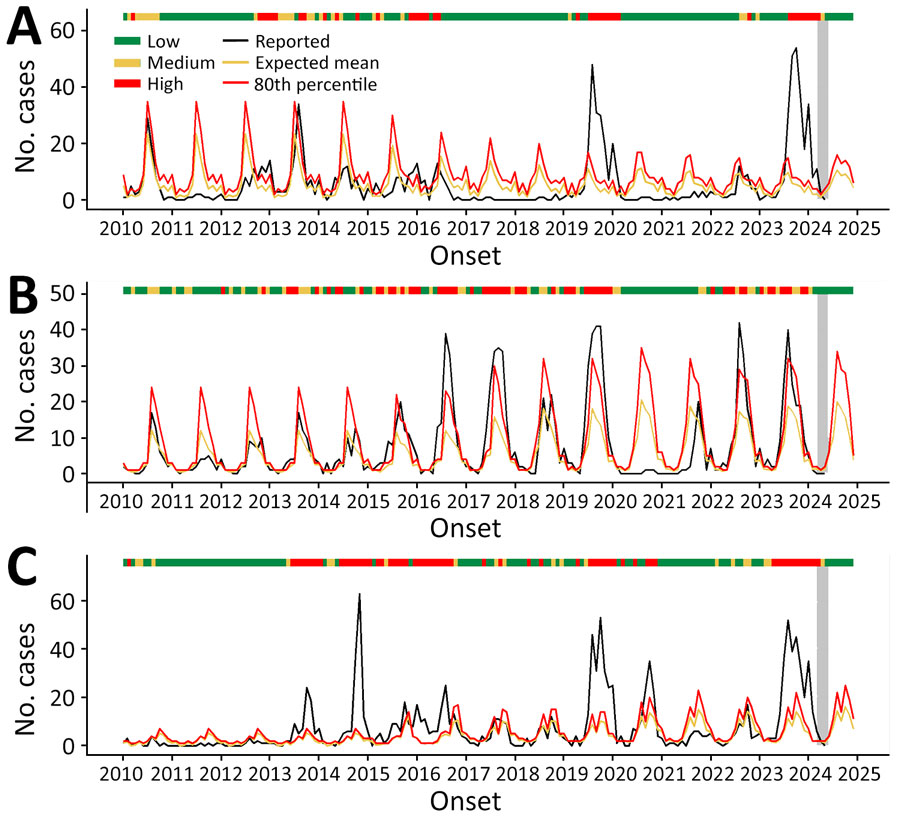
Figure 1. Temporal patterns and modeled transmission classification levels on the basis of percentile thresholds for dengue cases in travelers returning to the United States from the Dominican Republic (A), India (B), and Mexico (C), 2010–2024. Black line represents monthly dengue cases reported in US travelers. Yellow line represents expected mean number of cases on the basis of the fitted model. Red line represents the 80th percentile of the fitted distribution. Risk levels were categorized as low (green bar), medium (yellow bar), or high (red bar). We made those classifications on the basis of modeled case counts and did not incorporate the >10-case count criterion used in the Travel Health Notice classification. The most recent months of reported data at the time of analysis are shaded in gray to indicate periods of incomplete reporting. All 3 countries showed strong seasonal patterns and multiple sustained periods where traveler case counts exceeded the 80th percentile, reflected in frequent high-risk classifications, particularly during recent years (2022–2024).
1These first authors contributed equally to this article.